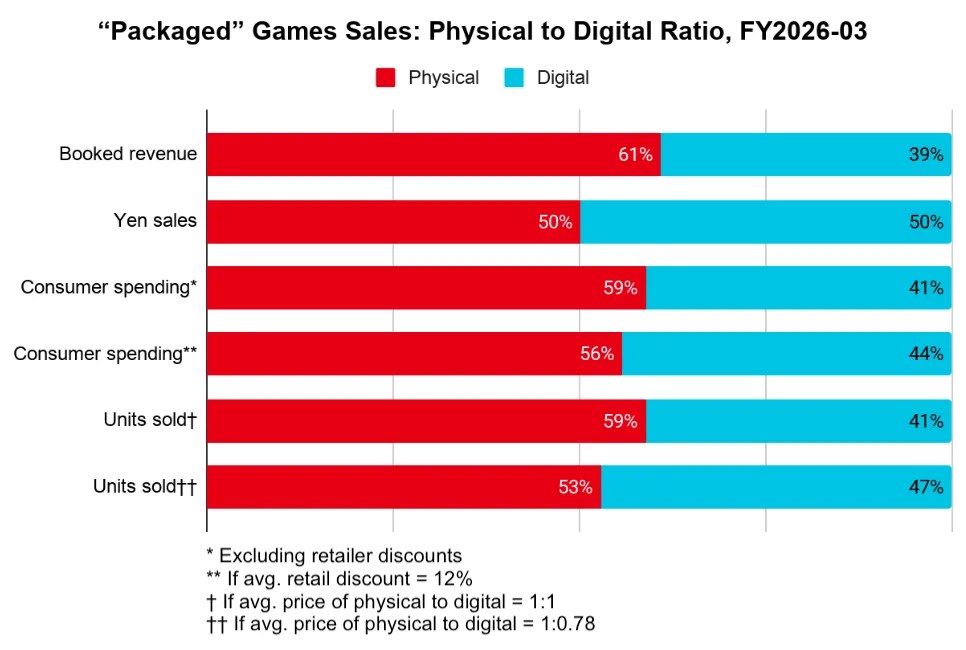
There’s been some hand-wringing re: Nintendo’s digital ratio. The official 54.6% number includes NSO, DLC, and download-only games (img below), therefore isn’t a good representation of customer behaviors. I did some math to strip away those to show only the digital ratio of “packaged” games (first img above). As you can see in the chart, physical packaged games still come out on top by every metric on the Switch platform. Below I’ll walk through these numbers; people who dislike math may skip to the end.
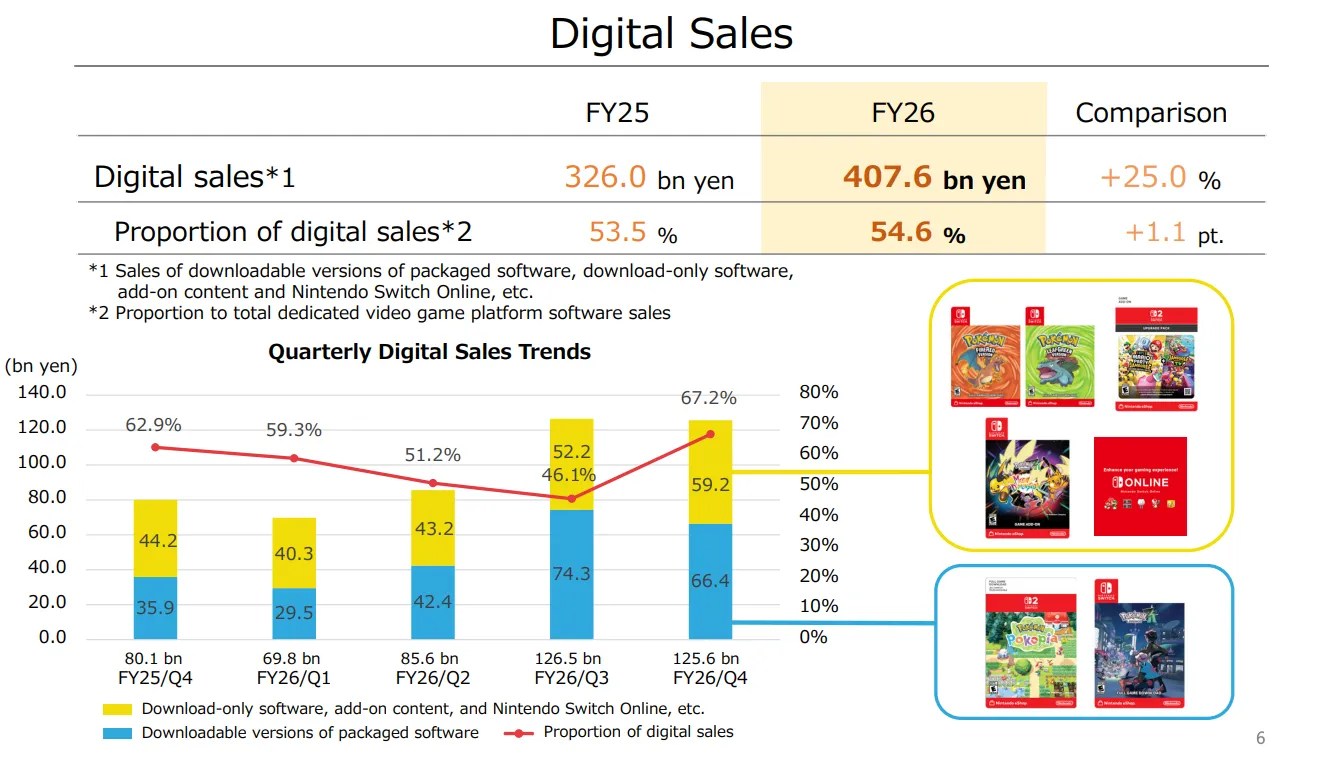
• In FY2026-03, digital sales was ¥407.6B and 54.6% of all software sales (img below), which means physical packaged games = ¥338.92B
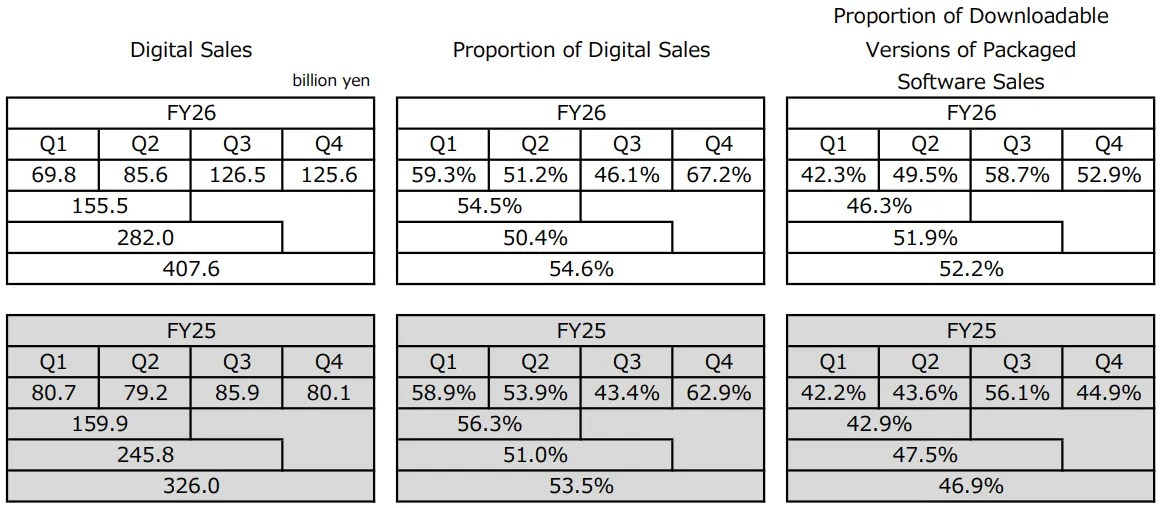
• 52.2% of digital sales was for download versions of packaged games, that means digital packaged games = ¥212.77B
• Thus, the ratio of booked revenues for physical and digital “packaged” games was ¥338.92B : ¥212.77B
➡️ Physical to digital booked revenue ratio = 61% : 39%
• However, Nintendo accounting only recognizes the 30% platform fees for 3rd party digital sales, so we need to adjust the number
• In FY20241 the unit sales ratio of 1st party to 3rd party packaged games was 47.4% to 52.6% (img below, I counted the pixels; see footnote for more info).
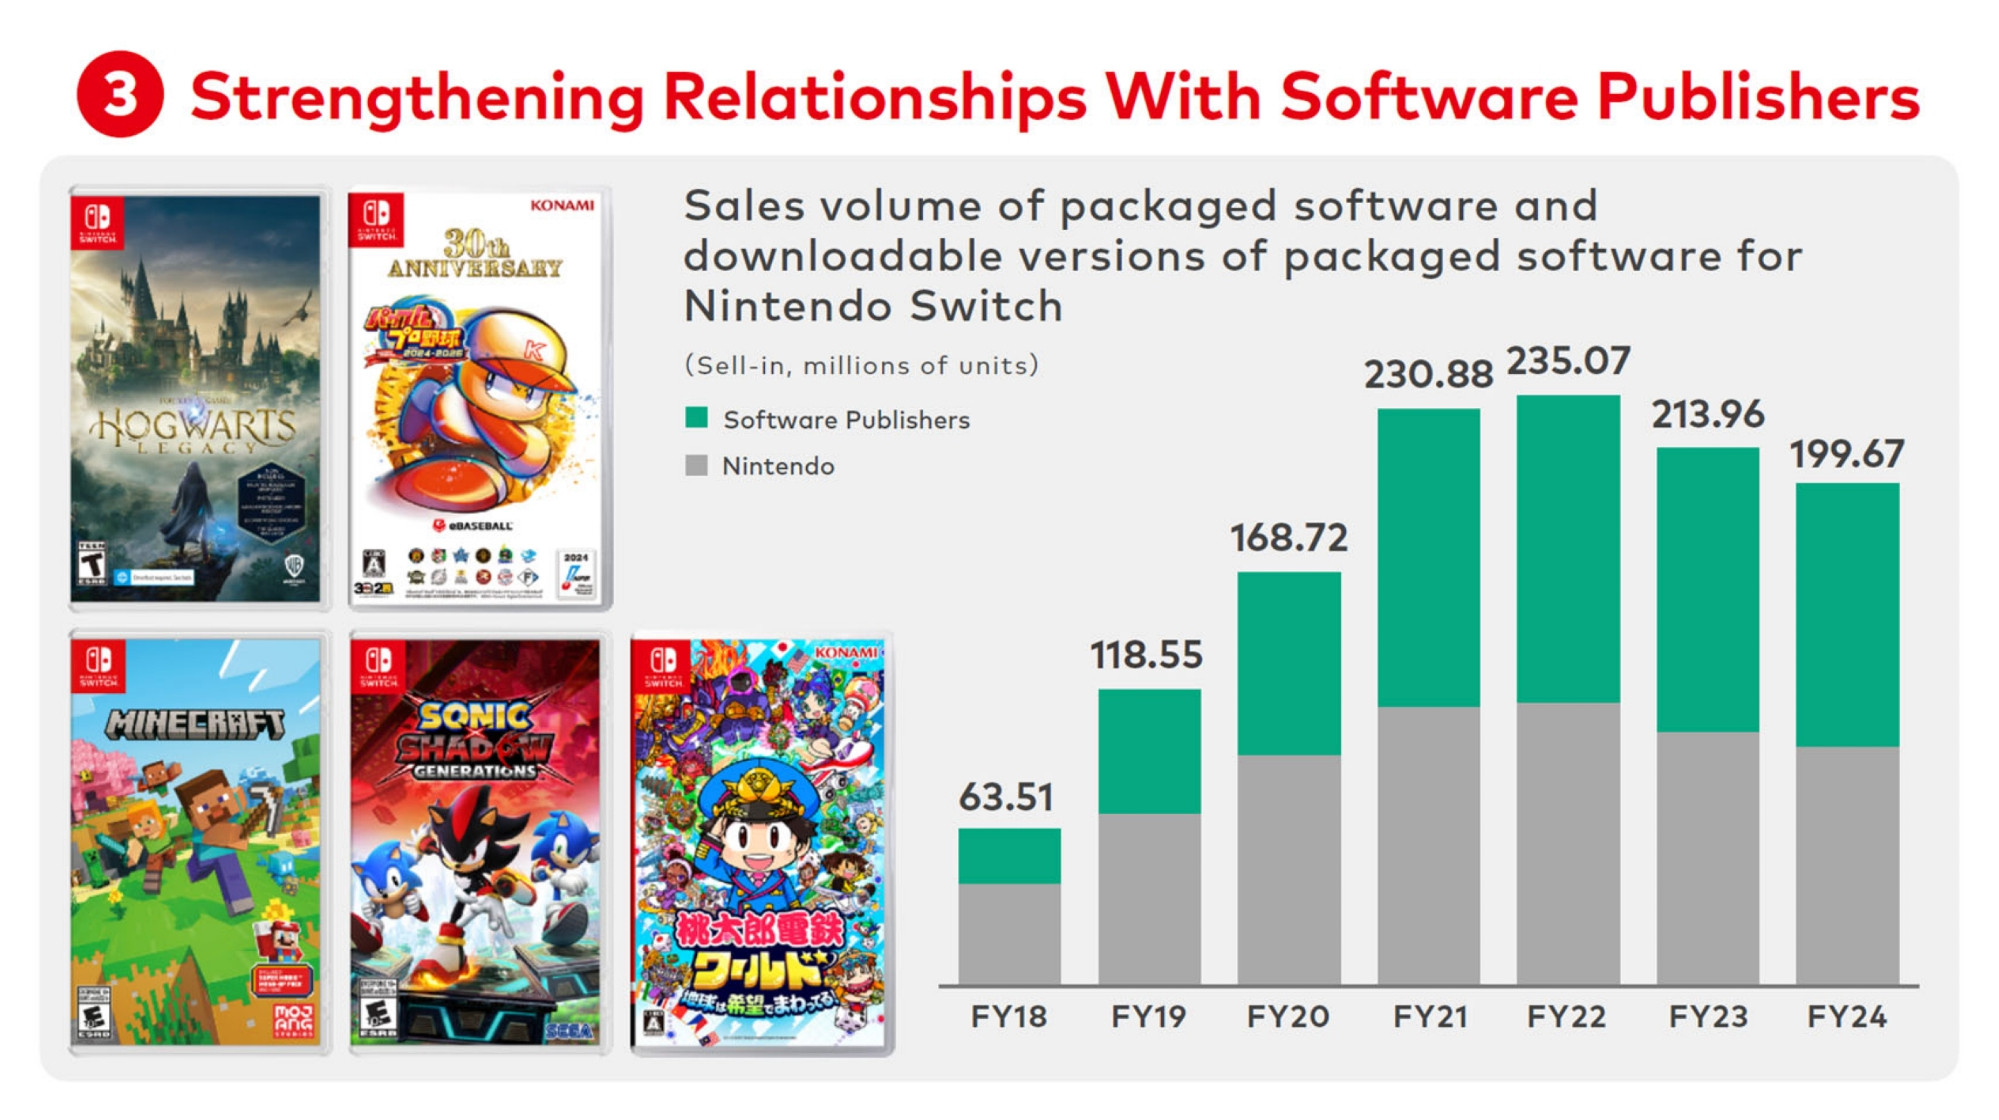
• Assuming the average sales prices of 1P and 3P packaged games were roughly equal (1:1, also see footnote), and 52.6% of the value (3P) was counted at only 30%, the true total sales—not just revenue—of digital packaged games = ¥336.77B
➡️ Physical to digital yen sales ratio was 50.2% to 49.8%
• However, the wholesale price of physical games is usually ~70% of MSRP. After we adjust that number, the ratio of consumer spending for physical and digital packaged games was ¥484.17B : ¥336.77B
➡️ Physical to digital consumer spending ratio was 59.0% to 41.0% (excluding retailer discounts)
• Assuming on average retailers sold games at a 12% discount, the physical spending should be lowered
➡️ Physical to digital consumer spending ratio was 55.9% to 44.1% (12% avg retail discount)
• Assuming the average sales prices of physical and digital games were roughly equal (1:1), we can use the ratio of consumer spending w/o discounts above for units sold too
➡️ Physical to digital units sold ratio was 59.0% to 41.0% (price of physical:digital = 1:1)
• However, if we assume that digital packaged games were on average sold at a discount of 22% vs. physical MSRP, we need to adjust upward the digital units sold
➡️ Physical to digital units sold ratio was 52.9% to 47.1% (price of physical:digital = 1:0.78)
Compared to my estimates for FY25, the digital ratio grew only a few points. None of these metrics (first img in the beginning) should dissuade Nintendo from their commitment to physical releases that Furukawa claiming “will remain unchanged going forward”—as unequivocal as an executive can publicly offer. This isn’t a company that operates solely on spreadsheets, as attested by their resolve to keep Hanafuda going.
- Regarding the use of FY24 unit sales ratio of 1P to 3P packaged games: a) Nintendo didn’t update the ratio since FY24, but it’d been stable since FY21. b) To be precise, we need the 1P:3P ratio in digital only. Unfortunately the blended 1P:3P ratio is the only official number I can find. c) If we assume that 3P weighs more on digital, it’d tilt the yen sales ratio toward digital.
However, I suspect that the sales price AVG of 3P packaged games is lower than 1P’s, which should cancel out—or at least blunt—3P’s lean on digital. Considering everything, it probably won’t change my conclusion directionally, that physical still outweighs digital on the Switch platform, for now. ↩︎
[Originally posted on 2026-07-09 Pacific Time]
