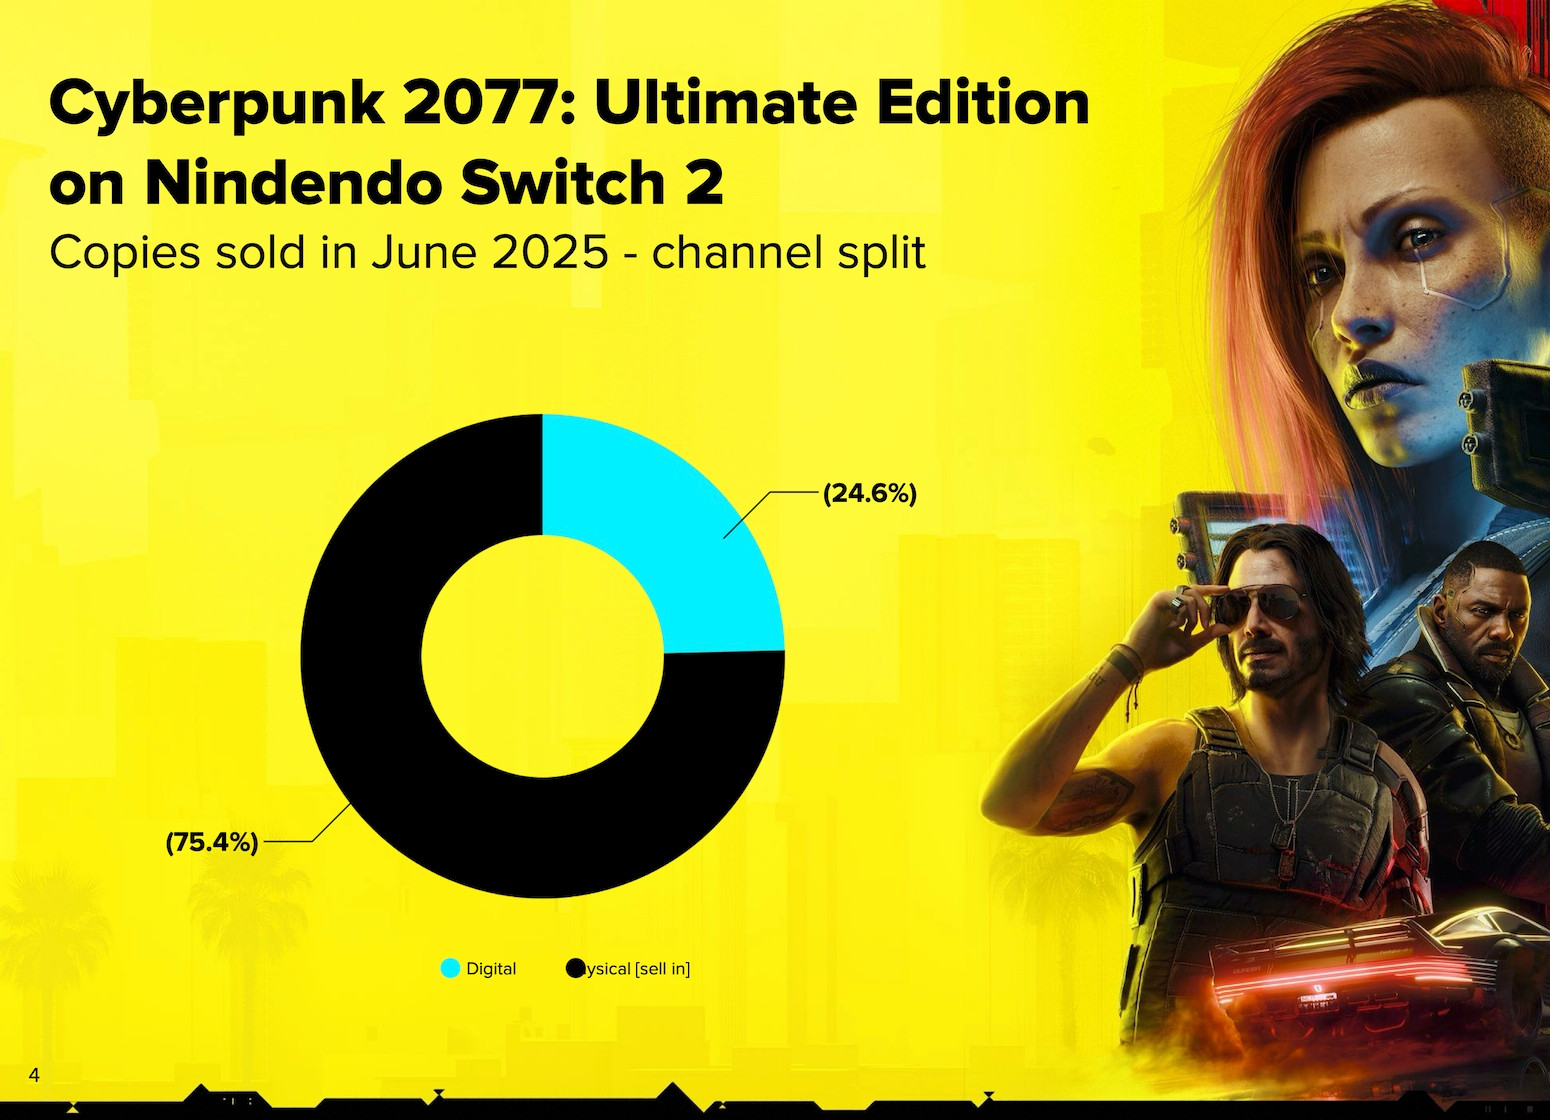
Cyberpunk 2077’s 75% physical sales in June is interesting. How about the other titles? Although Nintendo never disclosed such ratio, there’s enough data in their financial reports for us to work it out. Tl;dr: In FY2025-03, Nintendo’s booked revenue was 65% physical vs. 35% digital, and the ratio of units sold was around 57-63% physical vs. 43-37% digital.
Long answer:
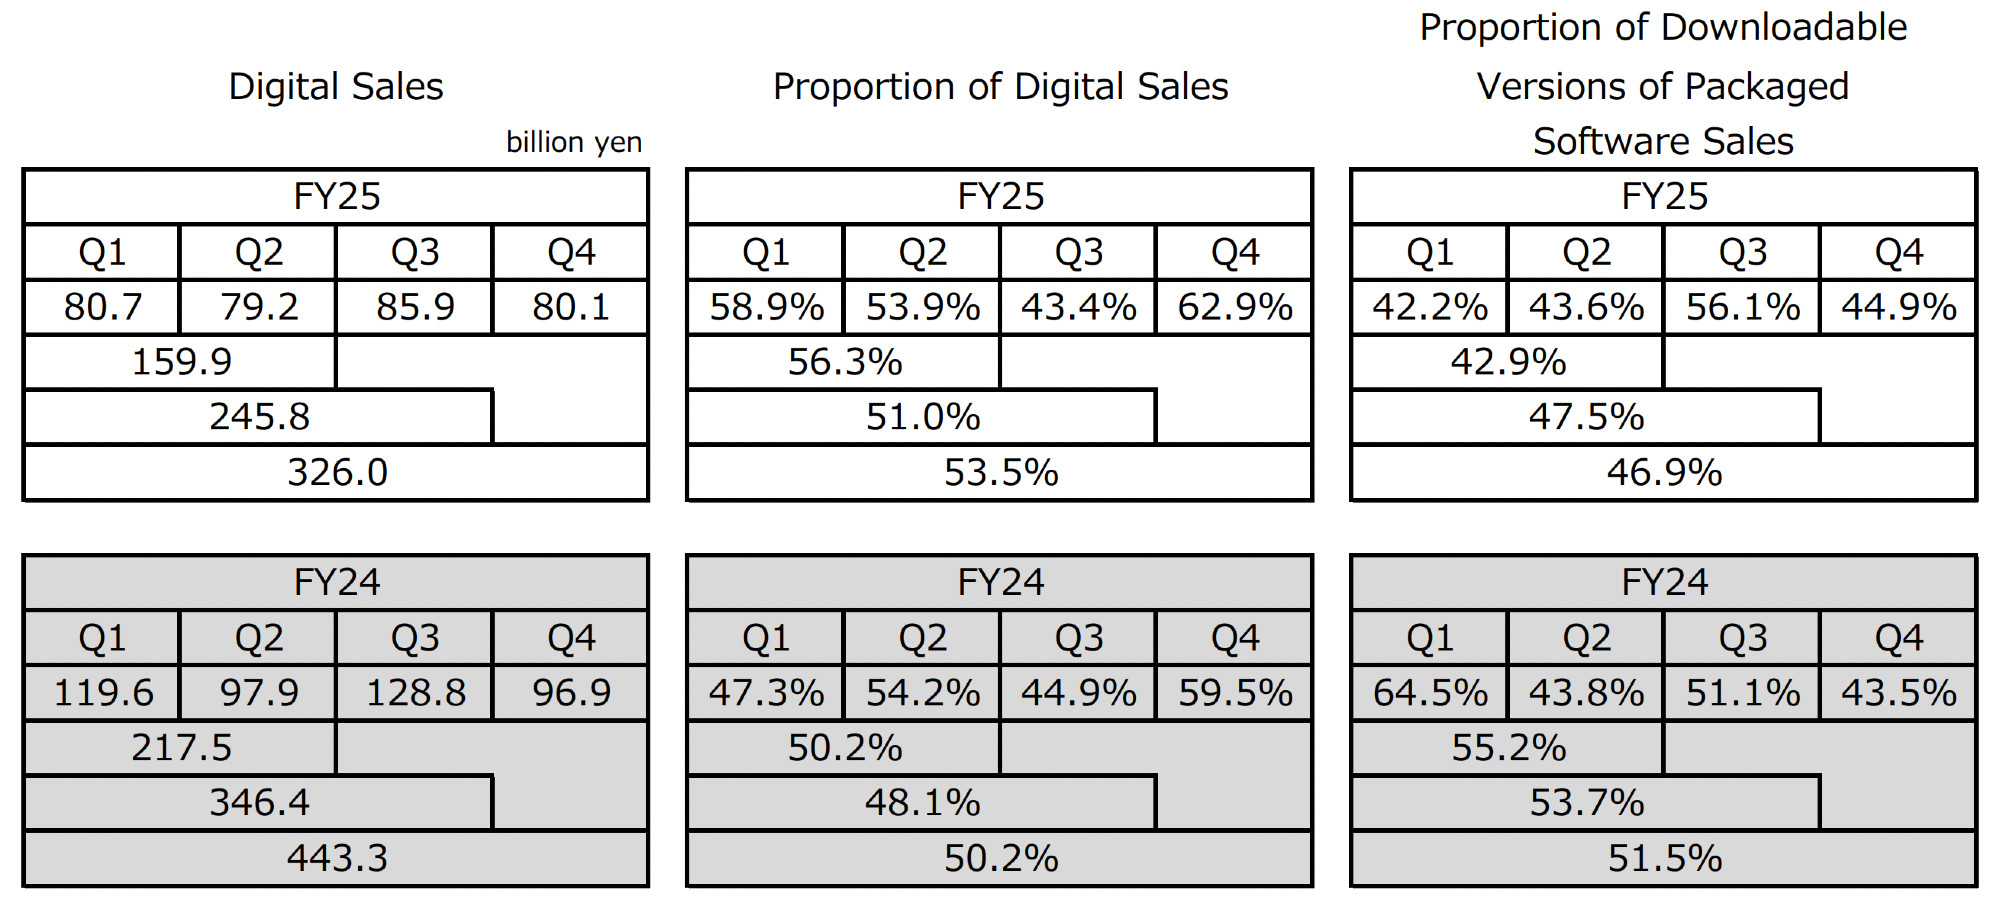
- In FY2025-03, digital sales was ¥326B and 53.5% of all software sales (image below), which means physical “packaged” games = ¥283.35B
- 46.9% of digital sales was for download versions of “packaged” games (image below), that means digital “packaged” games = ¥152.89B
- Thus, the ratio of booked revenues for physical and digital “packaged” games is ¥283.35B : ¥152.89B
→ Physical to digital booked revenue ratio was 65% to 35%
- However, Nintendo accounting only recognizes the 30% platform fees for 3rd party digital sales, so we need to adjust the number.
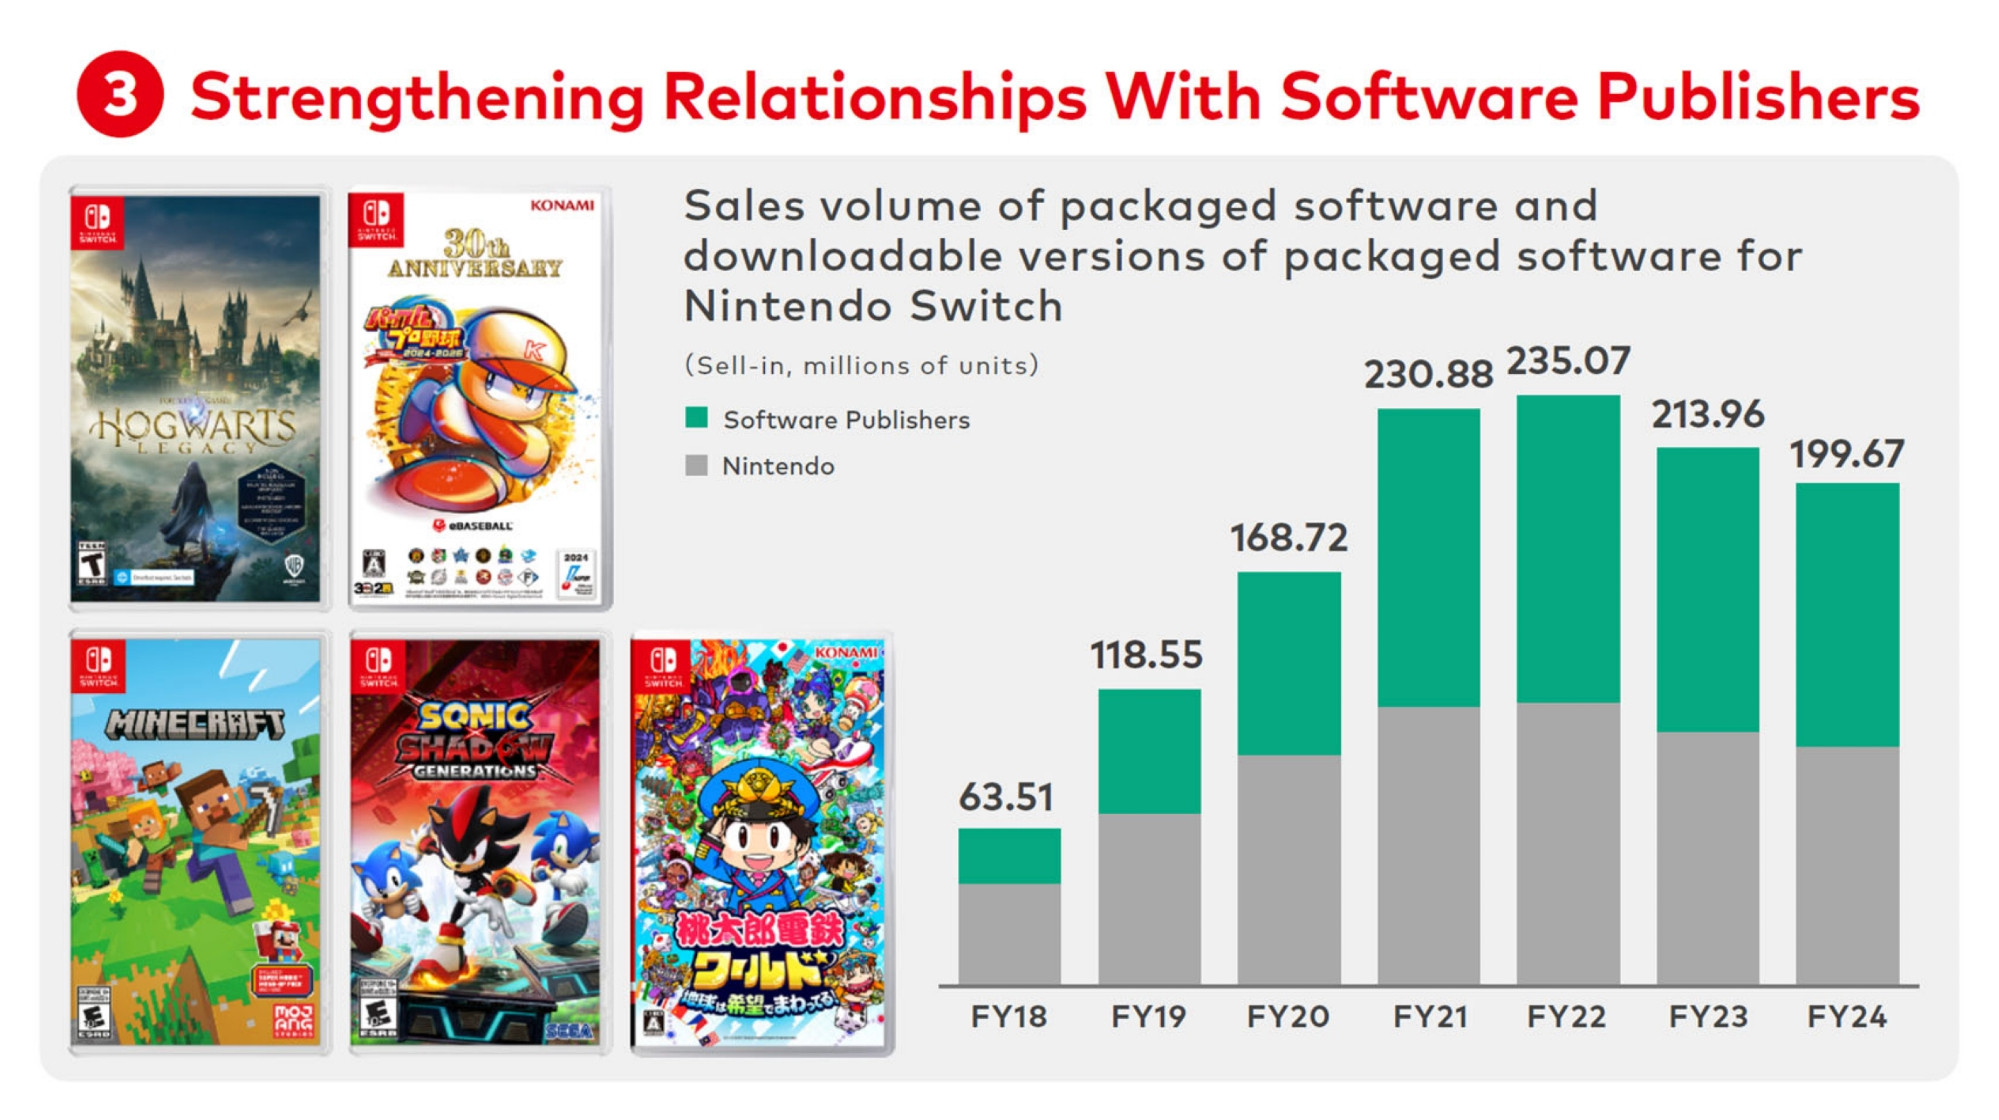
- In FY24 (not FY25, but it’s the latest number we can use as a proxy) the unit sales ratio of 1st and 3rd packaged games was 47.4% to 52.6% (image below; I counted the pixels).
- Assuming the average sales prices of 1P and 3P games are roughly equal (1 : 1), and 52.6% of ¥152.89B was counting only 30%, the true total sales—not just revenue—of digital packaged games = ¥241.99B
- Thus, the ratio of total yen sales for physical and digital packaged games is ¥283.35B : ¥241.99B
→ Physical to digital yen sales ratio was 53.9% to 46.1%
- However, the wholesale price of physical games is usually ~70% of MSRP. After we adjust that number, the the ratio of consumer spendings for physical and digital packaged games is ¥404.79B : ¥241.99B
→ Physical to digital consumer spending ratio was 62.6% to 37.4% (excluding retailer discounts) - Assuming the average sales prices of physical and digital games are roughly equal (1 : 1), we can use the ratio above for units sold too
→ Physical to digital units sold ratio was 62.6% to 37.4% - However, if we assume that digital packaged games are on average sold at a discount of 20% vs. physical MSRP, we need to adjust upward the digital units sold.
→ Physical to digital units sold ratio was 57.2% to 42.8%
[Update] An arithmetic error was corrected, and text slightly reformatted for clarity.
[Originally posted on 2025-08-31 Pacific Time]
