(After copying the last post from my Bluesky account, I realized that I forgot to copy the following Bluesky post when it was published in May. So here it is.)
Mochizuki persists with his poppycock of Switch 2 “slowdown”. Let’s look at some hard data for what’s really occurring:
![[Chart] FTC Monthly Revenues (Unit: 100M NTD) Date Monthly Revenue 2026-03 46.89 2026-02 72.02 2026-01 133.9 2025-12 138.5 2025-11 138.3 2025-10 149.2 2025-09 129.6 2025-08 138 2025-07 155.8 2025-06 136 2025-05 147.5 2025-04 128.9 2025-03 120.5 2025-02 94.19 2025-01 85.03 2024-12 151.5 2024-11 114.5 2024-10 65.71 2024-09 56.06 2024-08 67.84 2024-07 78.26 2024-06 59.79 2024-05 42.2 2024-04 33.03 2024-03 31.65 2024-02 22.28 2024-01 34.48 2023-12 31.43 2023-11 35.44 2023-10 53.97 2023-09 68.8 2023-08 78.93 2023-07 75.6 2023-06 60.63 2023-05 52.4 2023-04 50.2 2023-03 81.73 2023-02 63.55 2023-01 92.2 2022-12 112 2022-11 103 2022-10 86.69 2022-09 67.6 2022-08 55.54 2022-07 54.48 2022-06 56.35 2022-05 73.5 2022-04 60.57 2022-03 87.72 2022-02 57.1 2022-01 90.65 2021-12 80.15 2021-11 82.48 2021-10 116.5 2021-09 125 2021-08 113.4 2021-07 94.83 2021-06 74.04 2021-05 82.65 2021-04 68.34 2021-03 61.44 2021-02 46.09 2021-01 93.71 2020-12 102.1 2020-11 121.7 2020-10 119.7 2020-09 135.9 2020-08 111.2 2020-07 113.3 2020-06 93.01 2020-05 64.26 2020-04 72.25 2020-03 50.13 2020-02 13.32 2020-01 48.49 2019-12 67.64 2019-11 87.59 2019-10 110.5 2019-09 120.8 2019-08 135.4 2019-07 123.4 2019-06 85.4 2019-05 81.22 2019-04 59.77 2019-03 58.18 2019-02 25.64 2019-01 45.06 2018-12 75.27 2018-11 116.5 2018-10 124 2018-09 176.1 2018-08 147.4 2018-07 114.8 2018-06 119.7 2018-05 104.9 2018-04 104.6 2018-03 104.8 2018-02 87.3 2018-01 151.3 2017-12 189 2017-11 201.8 2017-10 212.5 2017-09 207.7 2017-08 149.1 2017-07 114.1 2017-06 101.4 2017-05 64 2017-04 55.63 2017-03 63.05 2017-02 43.66 2017-01 81.81](https://ninpatentswatch.com/wp-content/uploads/2026/07/bsky-3ml7agqu4lc2y-p1-m1.webp)
Image above shows the monthly revenues of Foxconn Technology Co. (FTC, 鴻準), a good proxy of Switch production volumes (because Nintendo is its biggest revenue source; img below).
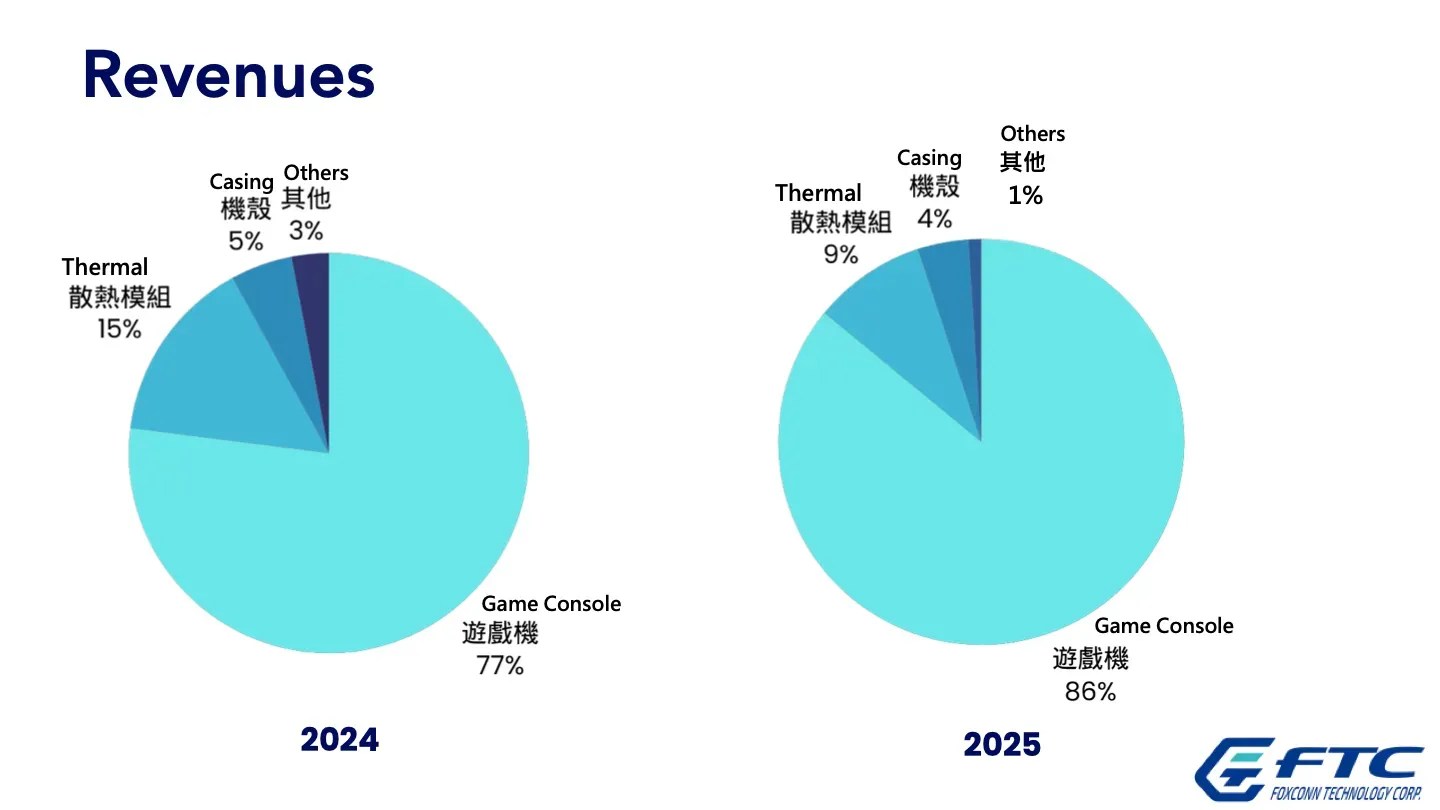
Note: A 2nd assembler Hosiden was added in 2019, and a 3rd MinebeaMitsumi in 2020. So for a fairer comparison, you may want to mentally lower the 2017-2018 numbers a lot and 2019 numbers a little.
As you can see, the production volumes are cyclical in waves, except the sustained high outputs between 2024-11 and 2026-01 to stockpile Switch 2 units. Yes, the productions in 2026-02 and -03 decreased sharply, but that isn’t a sign of slowing sales.
Looking at FTC’s revenues by calendar quarters (img 1 below) and Nintendo’s finished goods inventories (img 2) side-by-side, it’s evident that Q1 productions invariably dropped after the holiday shopping season, in order to adjust the inventory level. The most obvious examples are the high inventories in late 2018, 2019, and 2023—leading to the lowest productions in the following Q1s.
![[Chart] FTC Quarterly Revenues (Unit: 100M NTD) Quarter_Str Monthly Revenue 2017Q1 188.52 2017Q2 221.03 2017Q3 470.9 2017Q4 603.3 2018Q1 343.4 2018Q2 329.2 2018Q3 438.3 2018Q4 315.77 2019Q1 128.88 2019Q2 226.39 2019Q3 379.6 2019Q4 265.73 2020Q1 111.94 2020Q2 229.52 2020Q3 360.4 2020Q4 343.5 2021Q1 201.24 2021Q2 225.03 2021Q3 333.23 2021Q4 279.13 2022Q1 235.47 2022Q2 190.42 2022Q3 177.62 2022Q4 301.69 2023Q1 237.48 2023Q2 163.23 2023Q3 223.33 2023Q4 120.84 2024Q1 88.41 2024Q2 135.02 2024Q3 202.16 2024Q4 331.71 2025Q1 299.72 2025Q2 412.4 2025Q3 423.4 2025Q4 426 2026Q1 252.81](https://ninpatentswatch.com/wp-content/uploads/2026/07/bsky-3ml7agqu4lc2y-p3-m1.webp)
![[Chart] Nintendo Inventories—Finished Goods (Unit: 1M JPY) 2017-03 35,824 2017-09 128,906 2018-03 129,483 2018-09 300,886 2019-03 99,918 2019-09 197,389 2020-03 71,815 2020-09 128,445 2021-03 70,544 2021-09 173,487 2022-03 96,301 2022-09 153,174 2023-03 182,837 2023-09 249,920 2024-03 89,638 2024-09 149,991 2025-03 293,462 2025-09 359,434](https://ninpatentswatch.com/wp-content/uploads/2026/07/bsky-3ml7agqu4lc2y-p3-m2.webp)
The chart below is another visualization of this. Aside from Q1 2023 (TotK OLED Model launch) and 2025 (Switch 2 launch), Nintendo maintained a fairly consistent gap of production volumes between Q1 and the prior quarters—the Q1 2026 number is no exception. The “production cut” reported by Bloomberg is just the company rebalancing the inventory as it always has.
![[Chart] FTC Q1 Revenue vs Prev Q3 & Q4 AVG (Unit: 100M NTD) Year Q1 Revenue Avg Revenue (Prev Q3 & Q4) 2018 343.4 537.1 2019 128.88 377.035 2020 111.94 322.665 2021 201.24 351.95 2022 235.47 306.18 2023 237.48 239.655 2024 88.41 172.085 2025 299.72 266.935 2026 252.81 424.7](https://ninpatentswatch.com/wp-content/uploads/2026/07/bsky-3ml7agqu4lc2y-p5-m1.webp)
[Speculation] It seems to me that Mochizuki’s source(s) used the assembler data to concoct stories, possibly for market manipulation. Check out Nintendo’s share price movements before and after Bloomberg’s “25M units production” and “30% output cut” reports, respectively.
[Originally posted on 2026-05-06 Pacific Time]
