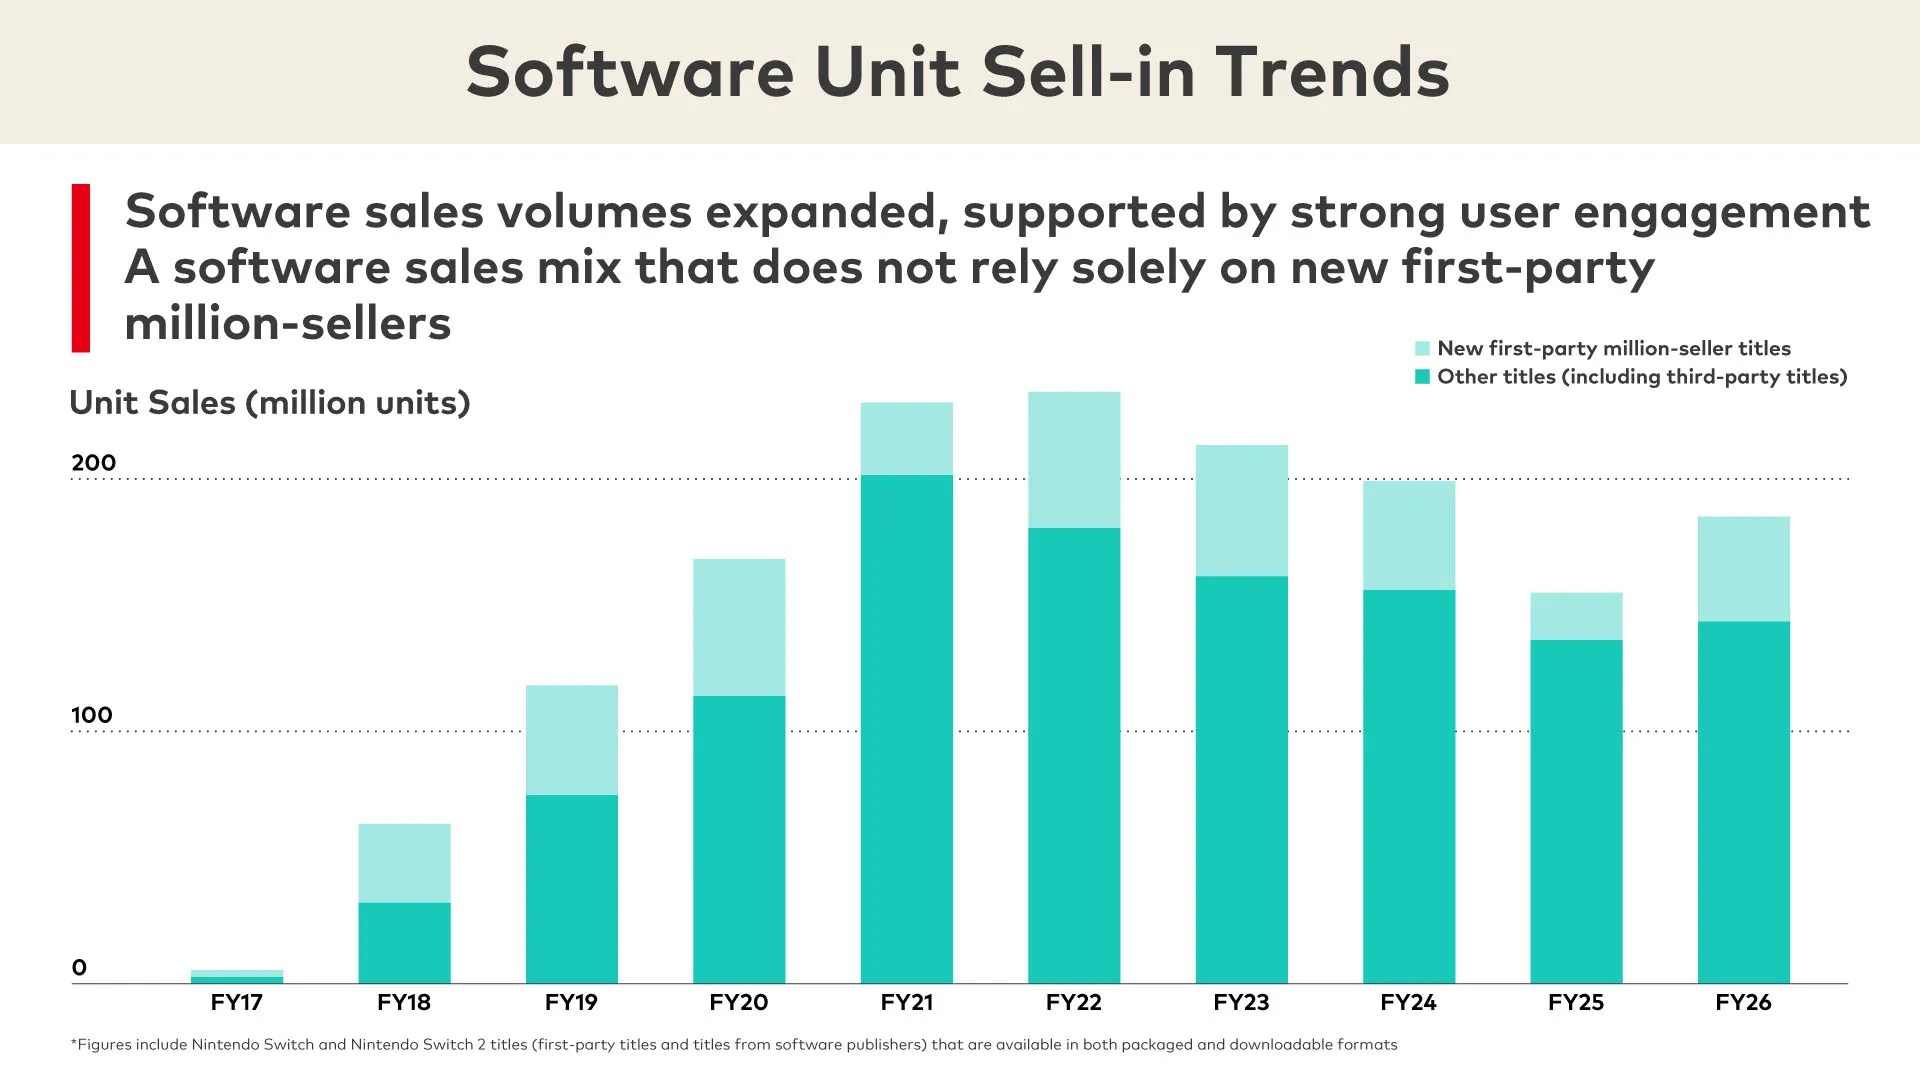
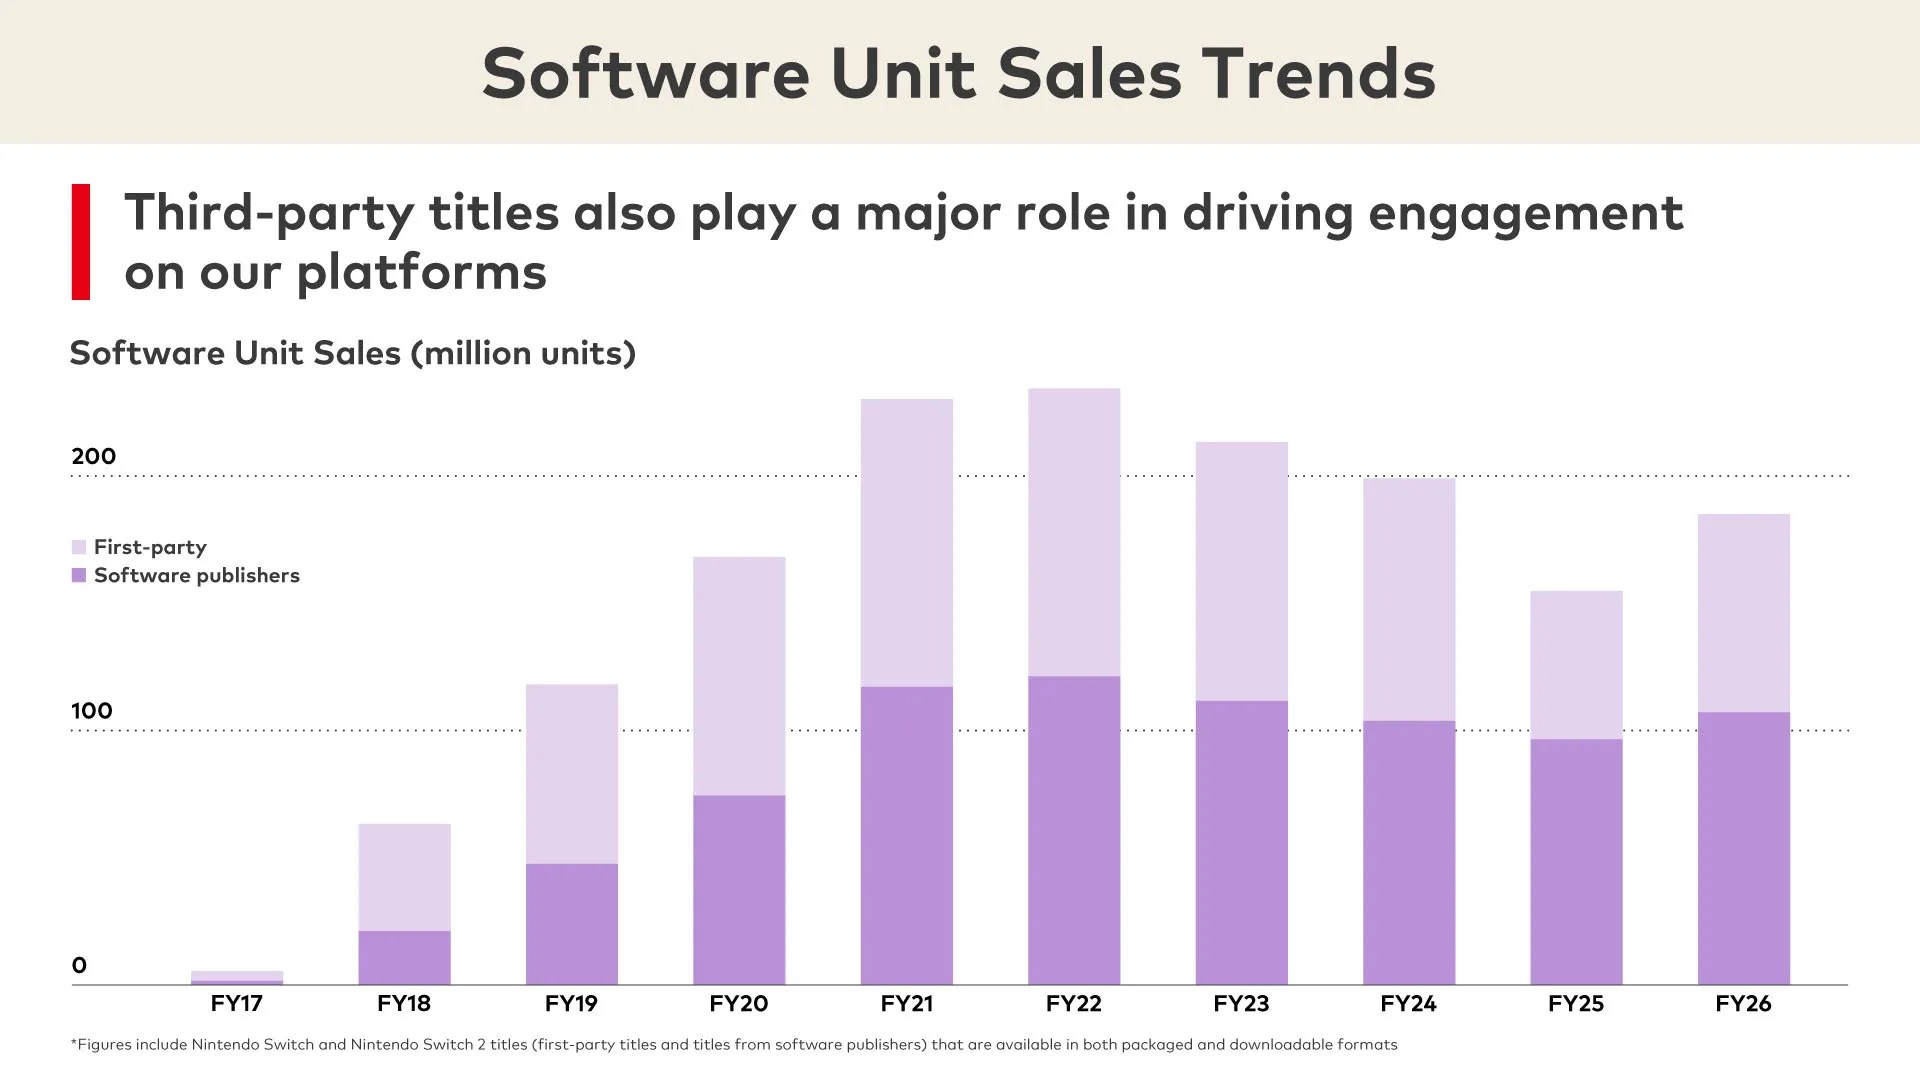
It’s widely understood that Nintendo’s evergreen titles are the foundation of their software sales, but how much is their share of sales? By combining two charts from the latest Policy Briefing (imgs 1-2), we can break down each year’s unit sales into three categories (img 3):
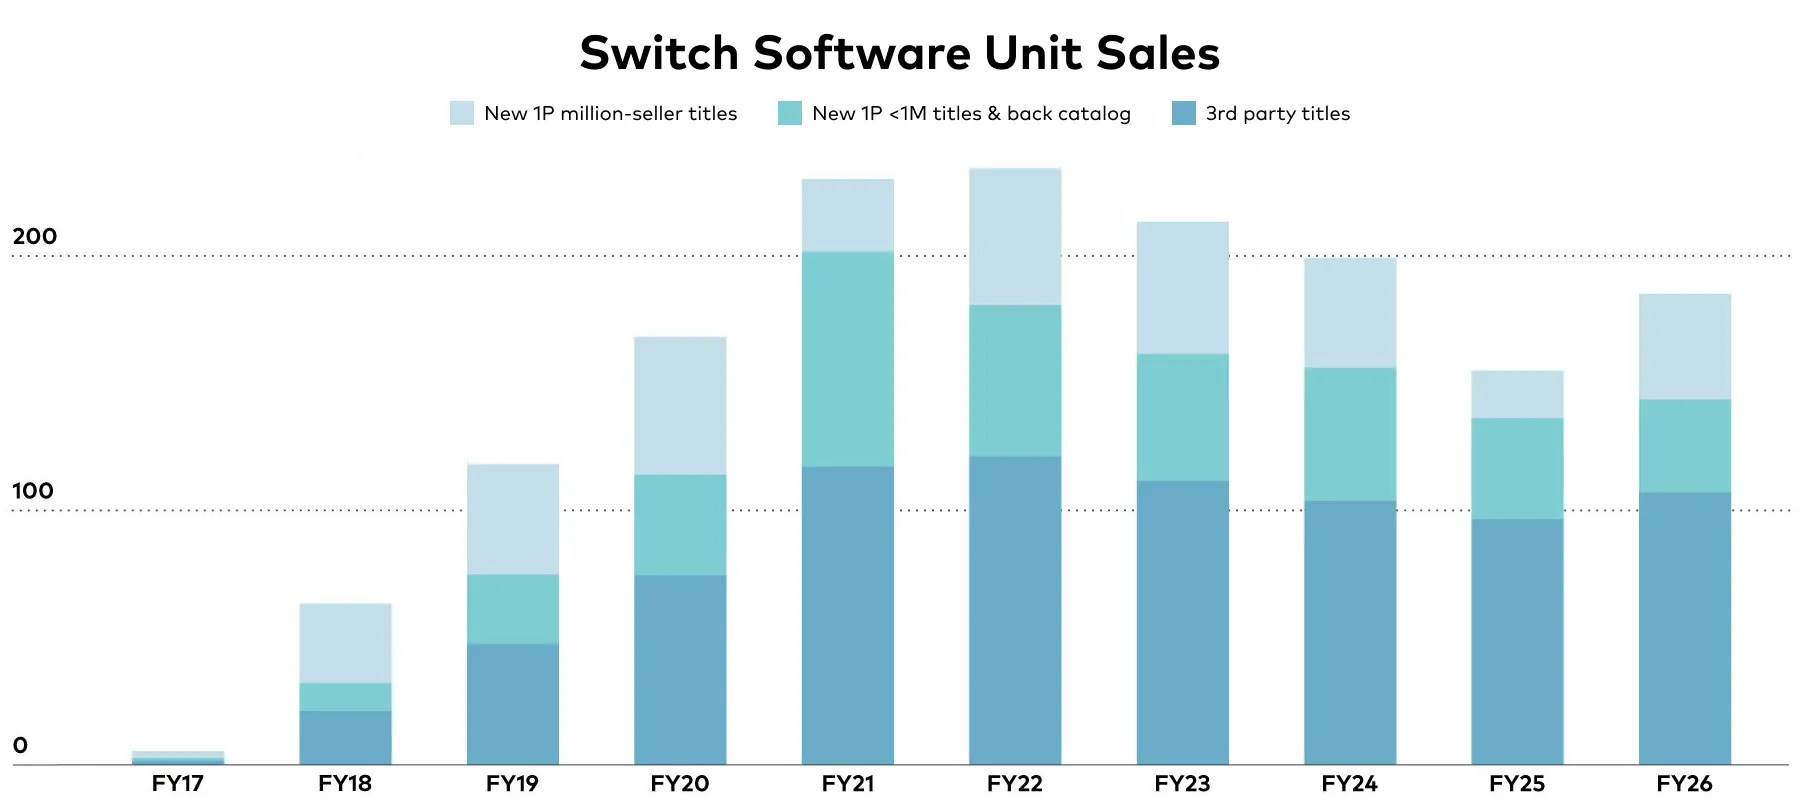
- New 1st party million-sellers
- New 1st party <1M titles & back catalog
- 3rd party titles
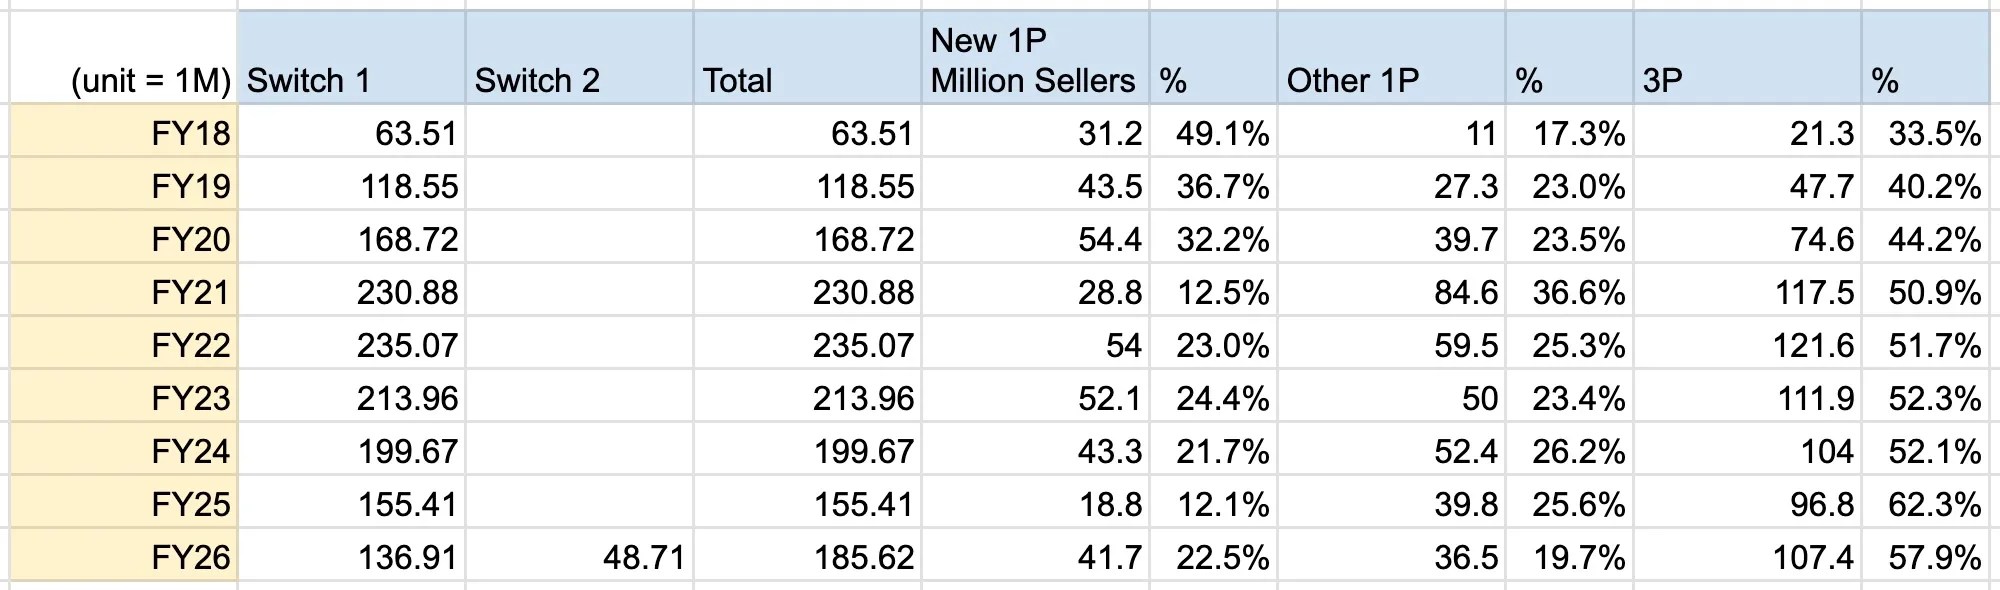
The table above contains the sales numbers by category that I estimated by counting pixels (±0.3M margin). Judging from the merged chart and data table, Nintendo’s back catalog consistently sold well, even during years without many new million-sellers (FY21 & FY25), and continues to anchor software sales in the current cross-gen period (FY26).
[Notes]
- The unit sales data excludes digital-only titles
- H/t: X user _akatama_ for the initial idea
[Originally posted on 2026-11-08 Pacific Time]
