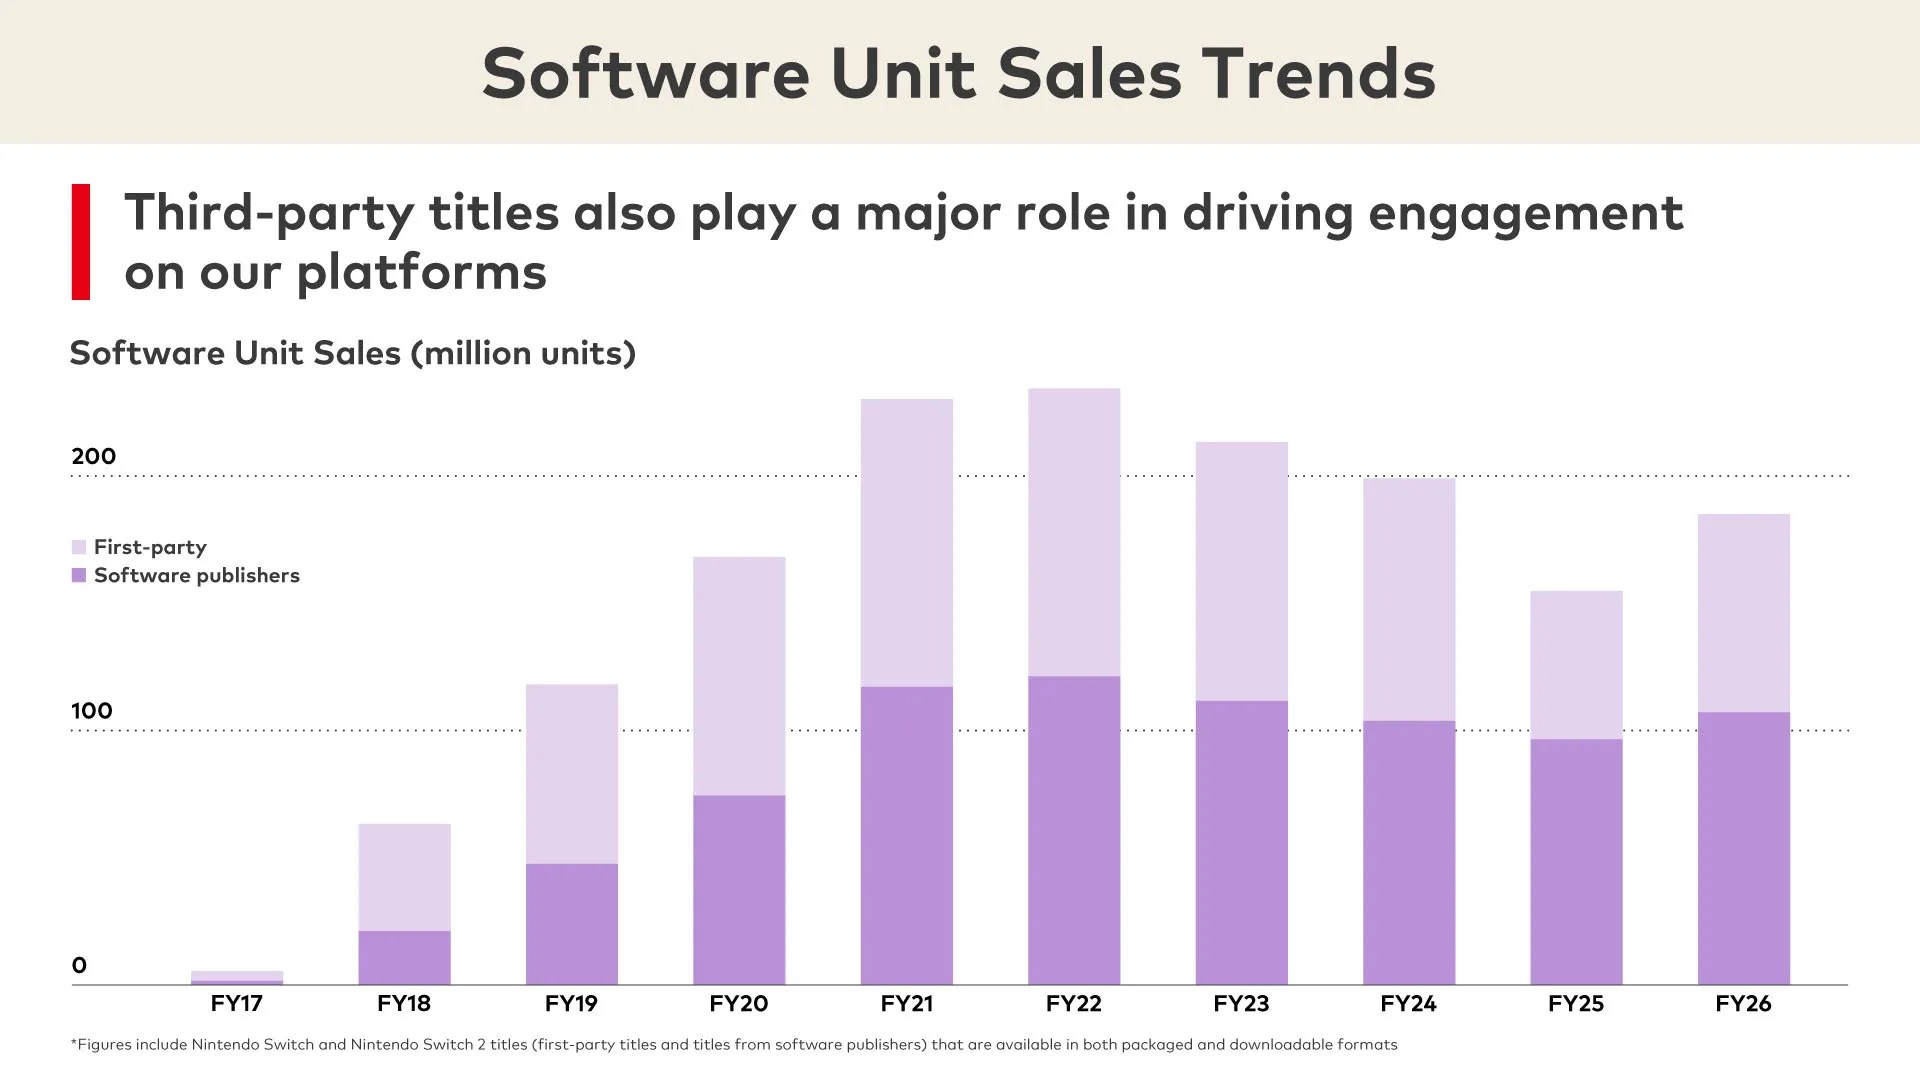
After skipping a year, Nintendo resumes reporting the unit ratio between 1st and 3rd party software sales, excluding digital-only titles. It’s more instructive than the revenue ratio IMHO. The chart below shows a clear trend of increasing 3rd party support for the Switch platform, from an anemic 33.1% in FY18 to a 57.9% majority in FY26.
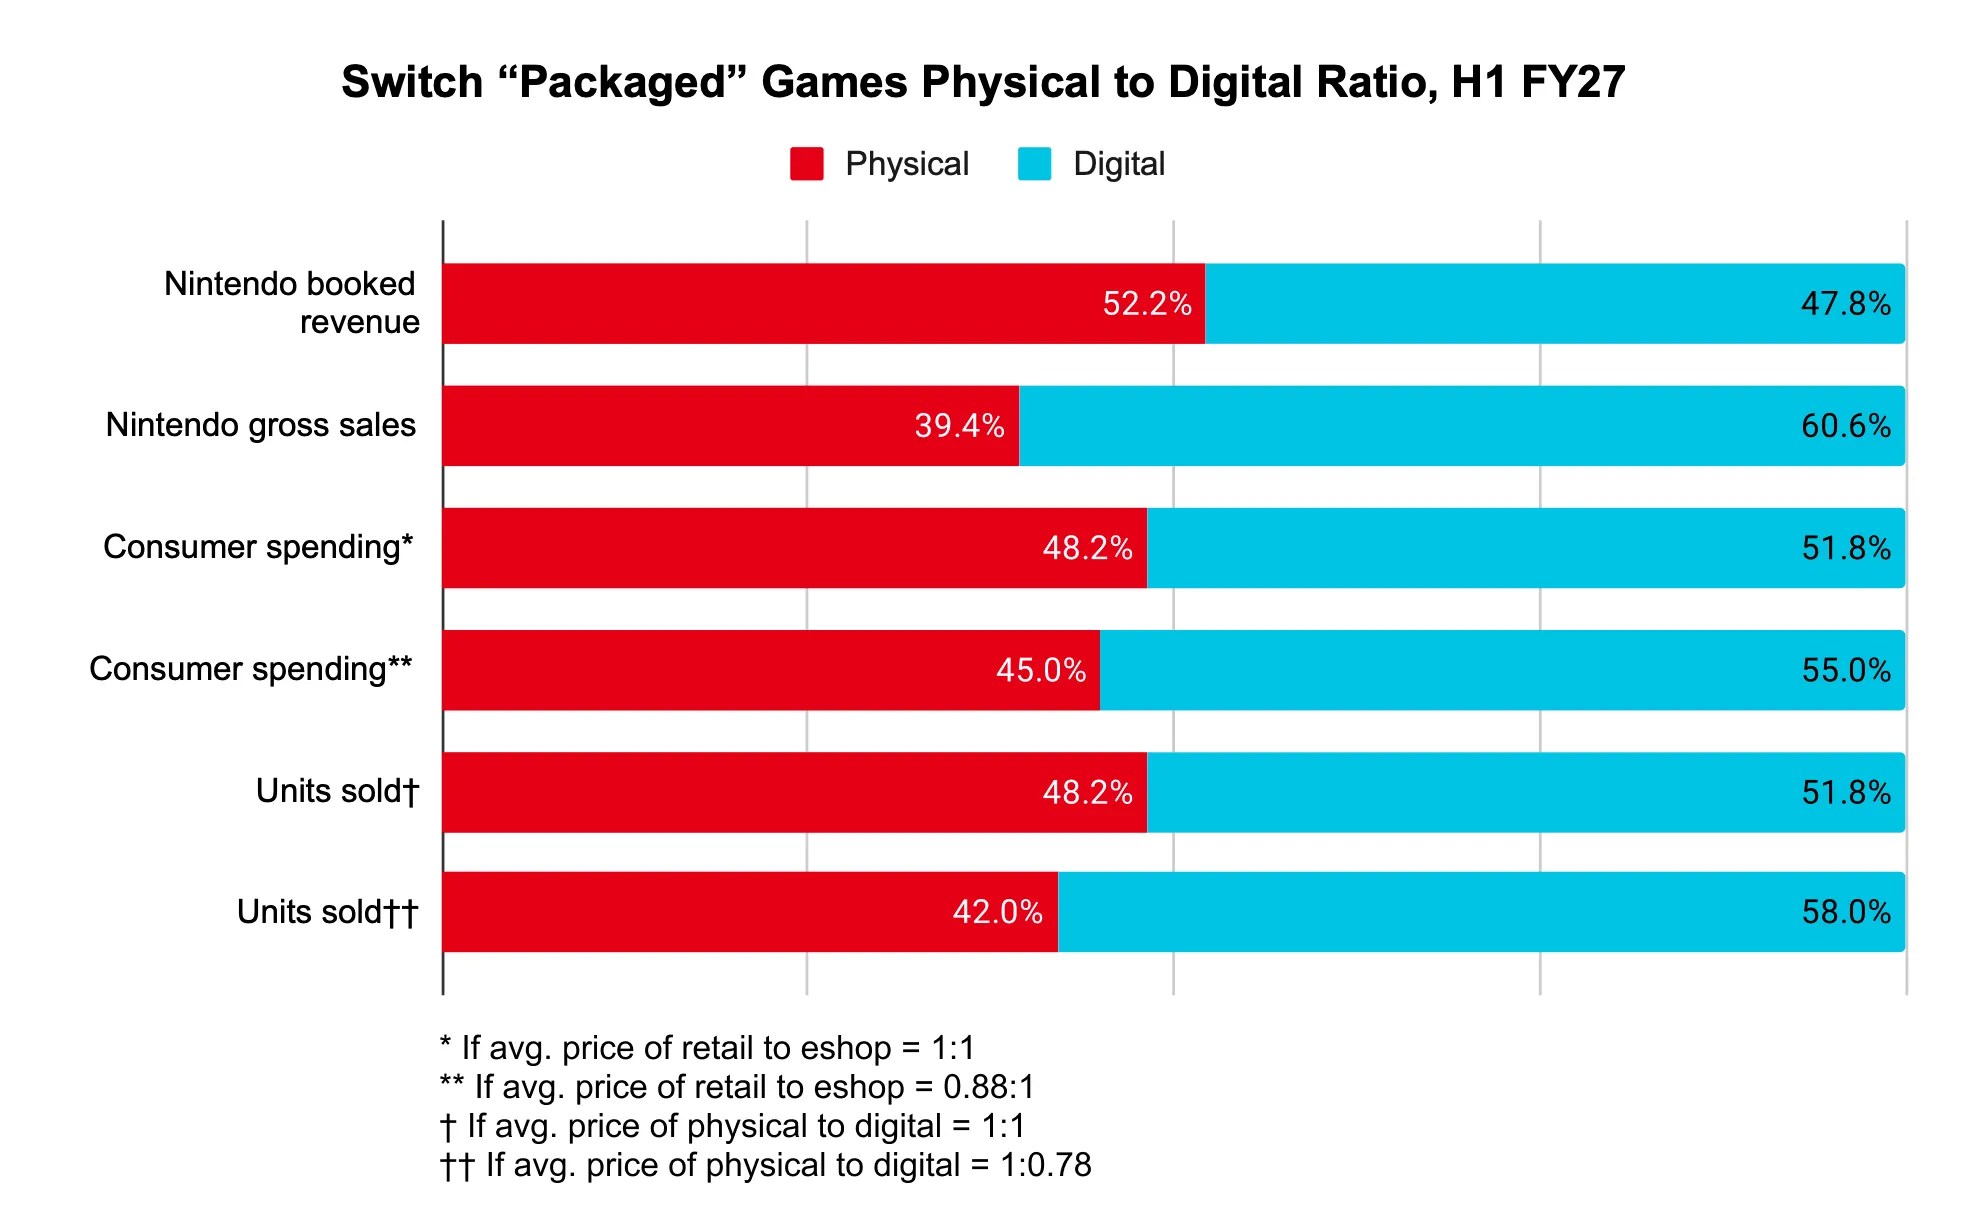
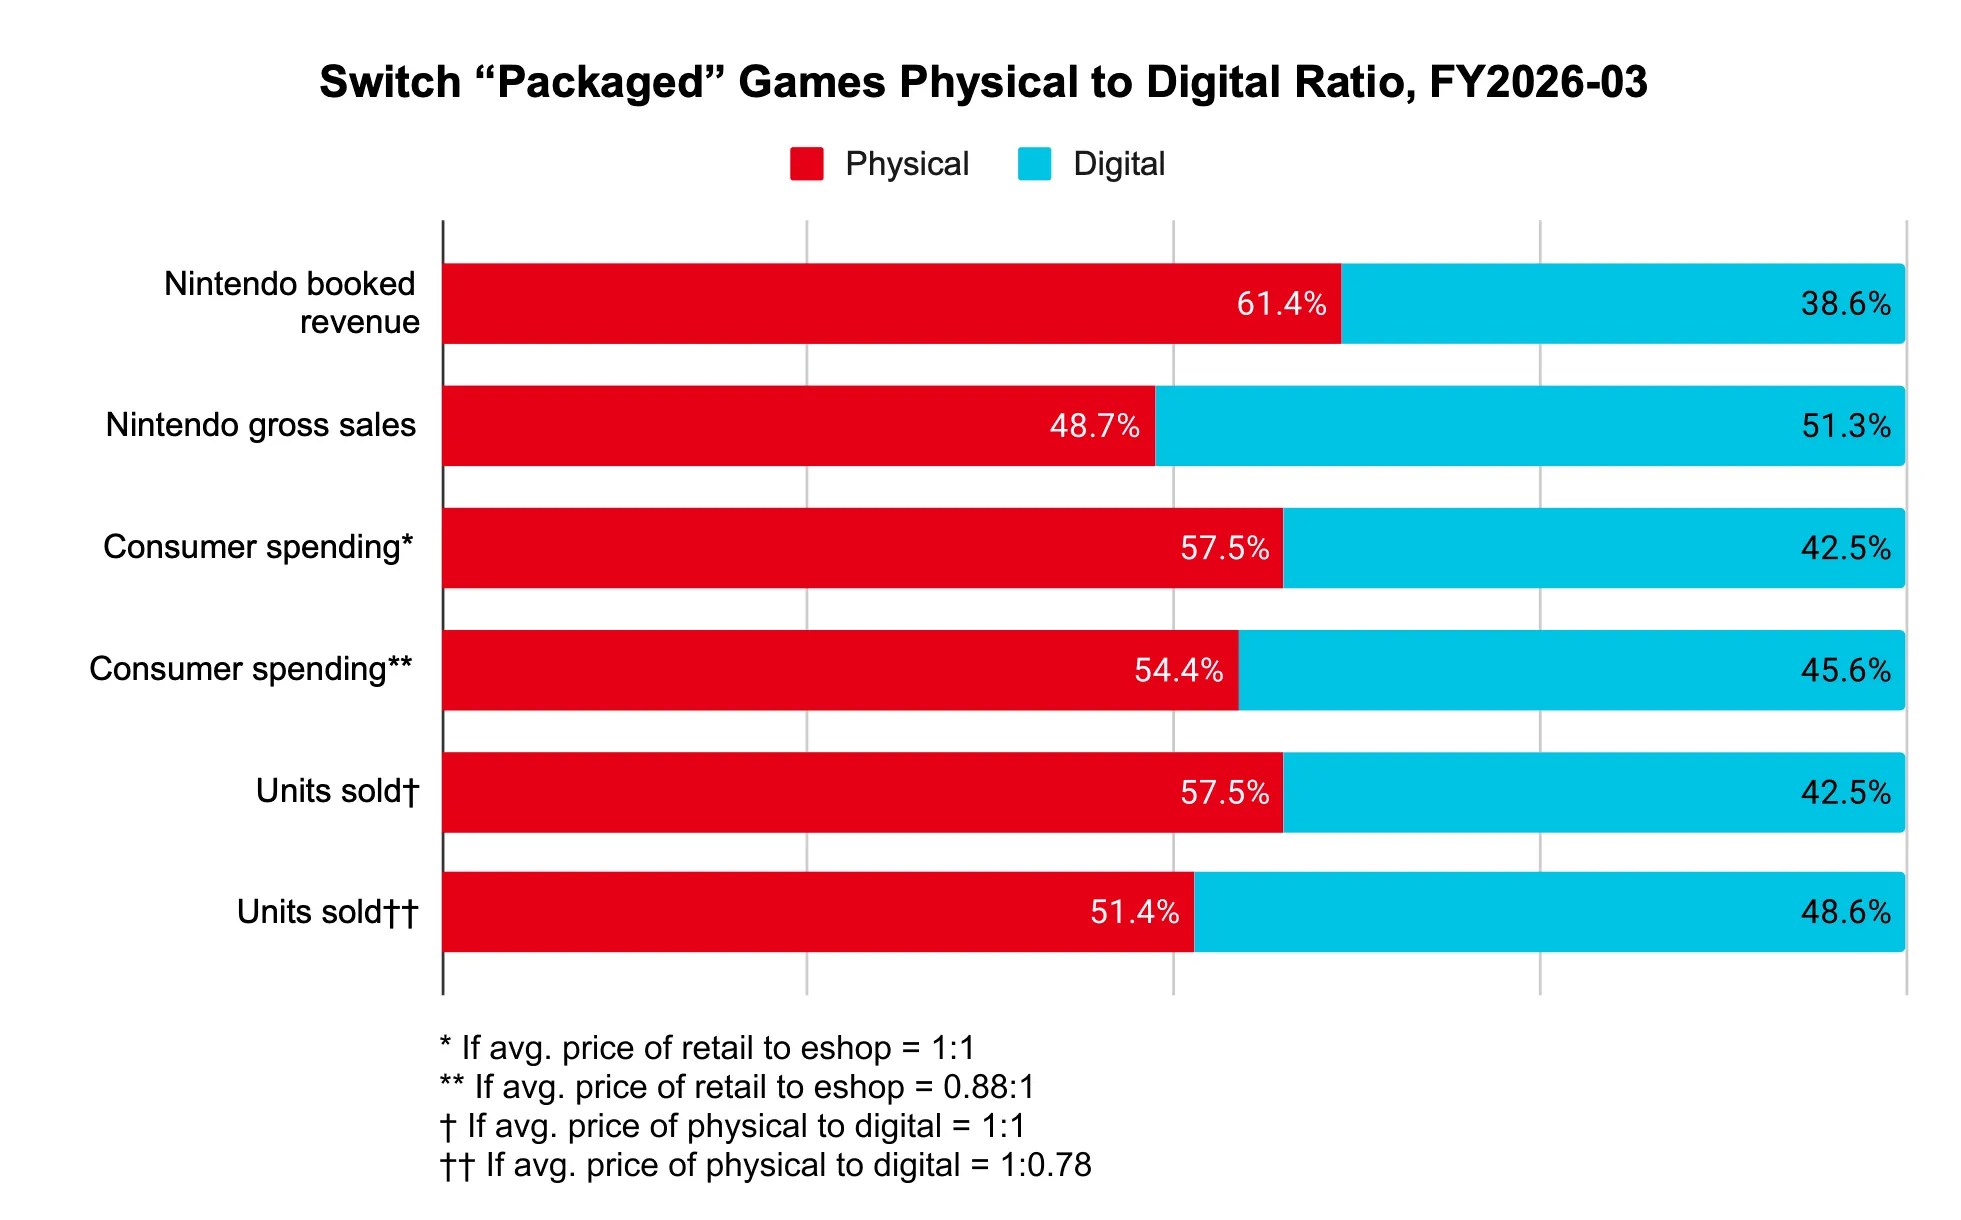
[Important note] Using the new unit sales ratio, I updated my estimated physical-to-digital ratios for H1 FY27 and FY26 (imgs below). The changes are minor: Aside from the booked revenue, the share of physical decreased ~1.5% in the other metrics. See my methodology here.
[Originally posted on 2026-11-07 Pacific Time]
