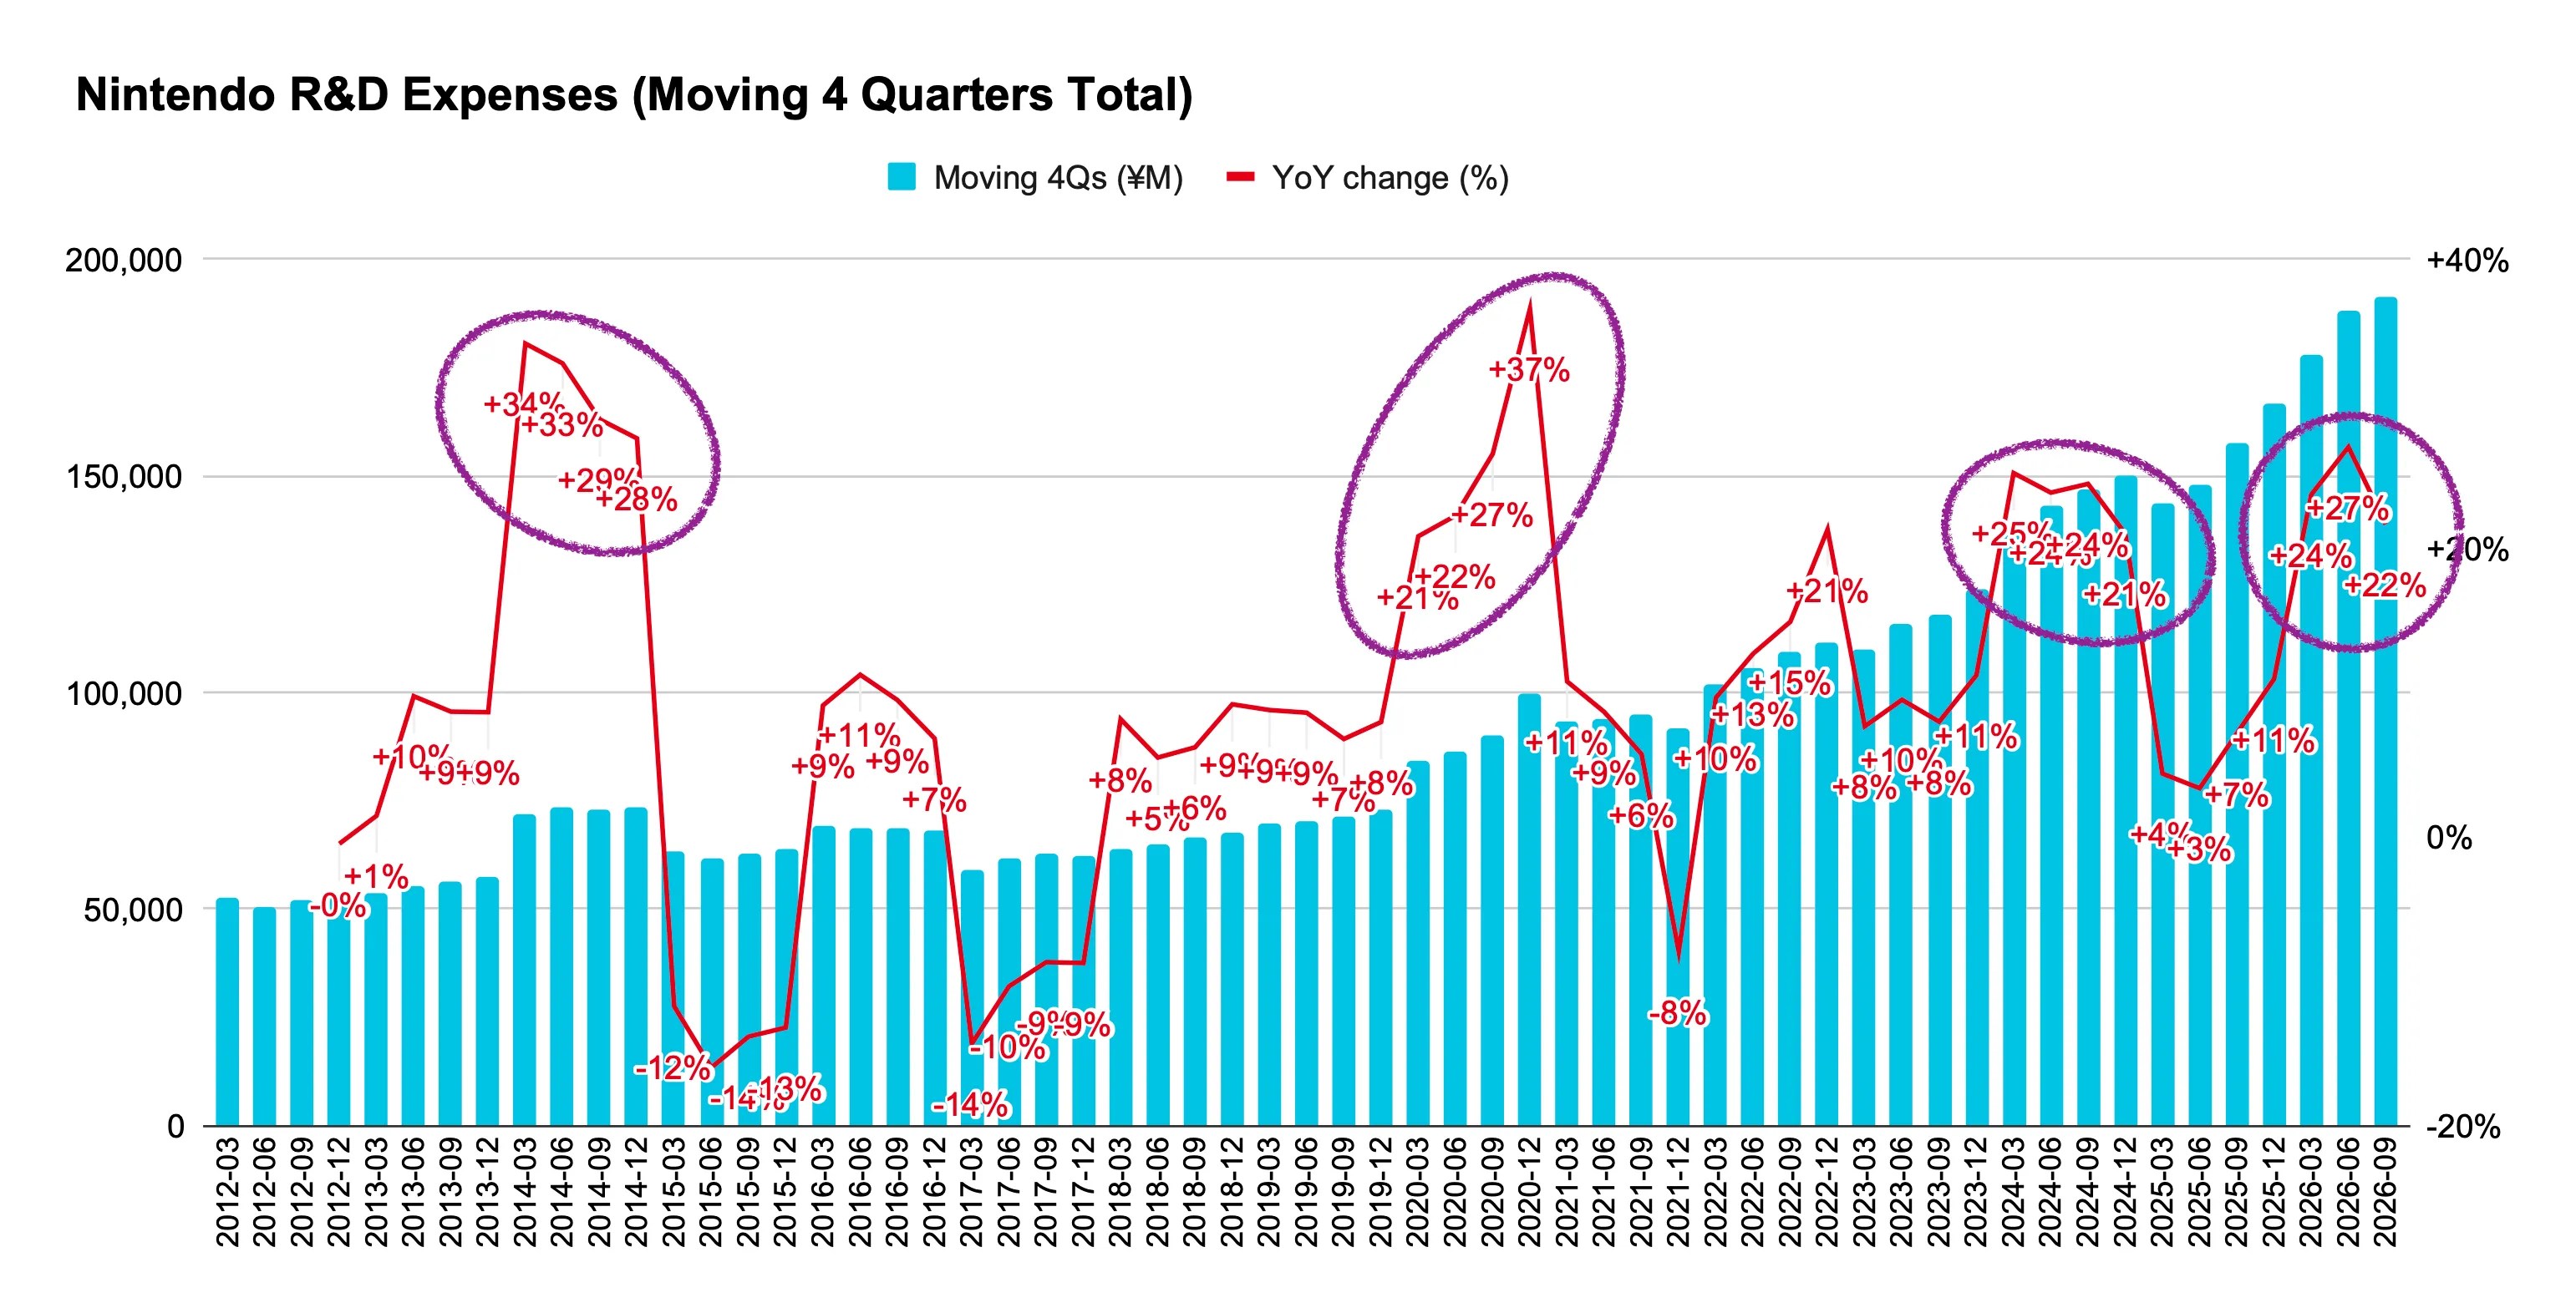
Nintendo’s R&D expenses in Q2 totaled ¥47.1B, thus -4% QoQ and +8% YoY. On the surface that’s unremarkable, but the company is currently in a period of elevated R&D spending:
![[Chart] Nintendo R&D Expenses (Moving 4 Quarters Total and YoY Change)
2012-03 52,675
2012-06 50,400
2012-09 51,967
2012-12 52,910 -0%
2013-03 53,447 +1%
2013-06 55,314 +10%
2013-09 56,477 +9%
2013-12 57,482 +9%
2014-03 71,718 +34%
2014-06 73,464 +33%
2014-09 72,814 +29%
2014-12 73,355 +28%
2015-03 63,296 -12%
2015-06 61,724 -16%
2015-09 62,741 -14%
2015-12 63,663 -13%
2016-03 69,064 +9%
2016-06 68,660 +11%
2016-09 68,690 +9%
2016-12 68,005 +7%
2017-03 59,171 -14%
2017-06 61,554 -10%
2017-09 62,729 -9%
2017-12 62,062 -9%
2018-03 63,999 +8%
2018-06 64,938 +5%
2018-09 66,624 +6%
2018-12 67,765 +9%
2019-03 69,624 +9%
2019-06 70,528 +9%
2019-09 71,143 +7%
2019-12 73,160 +8%
2020-03 84,127 +21%
2020-06 86,227 +22%
2020-09 90,027 +27%
2020-12 99,927 +37%
2021-03 93,187 +11%
2021-06 93,687 +9%
2021-09 95,187 +6%
2021-12 91,987 -8%
2022-03 102,182 +10%
2022-06 105,582 +13%
2022-09 109,382 +15%
2022-12 111,582 +21%
2023-03 110,014 +8%
2023-06 115,614 +10%
2023-09 118,114 +8%
2023-12 124,079 +11%
2024-03 137,749 +25%
2024-06 143,194 +24%
2024-09 147,008 +24%
2024-12 150,156 +21%
2025-03 143,788 +4%
2025-06 148,024 +3%
2025-09 157,549 +7%
2025-12 166,586 +11%
2026-03 177,890 +24%
2026-06 188,009 +27%
2026-09 191,670 +22%](https://ninpatentswatch.com/wp-content/uploads/2026/11/bsky-3mzorl5sk6k2w-p3-m1.webp)
The image above shows the moving 4-quarter total (to smooth out short-term fluctuations) for each quarter since 2012. Whenever there was a period of sustained +20% YoY increase in R&D, a new hardware followed:
2014 → Switch (Lite also conceived?)
2020 → Switch OLED
2024 → Switch 2
2026 → ???
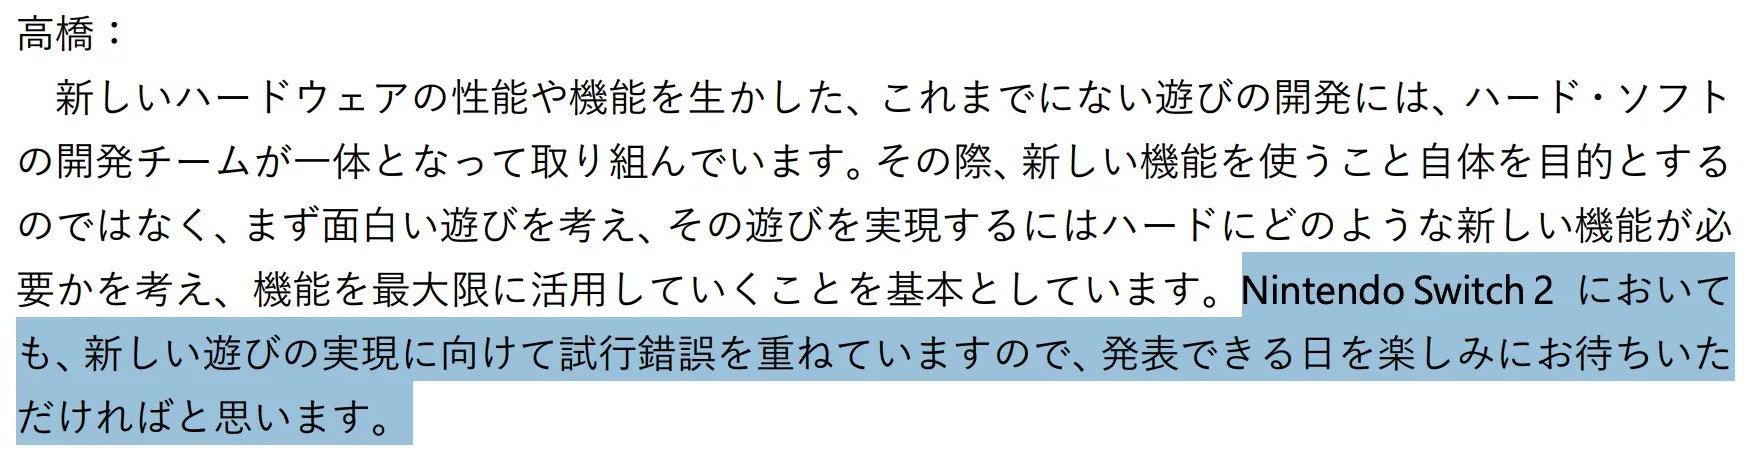
In the latest Q&A, Shinya Takahashi stated that “new ways to play” are being worked on (image below). It could be just a platitude, but what if?
Reference: My previous look at the annual R&D expenses
[Originally posted on 2026-11-06 Pacific Time]