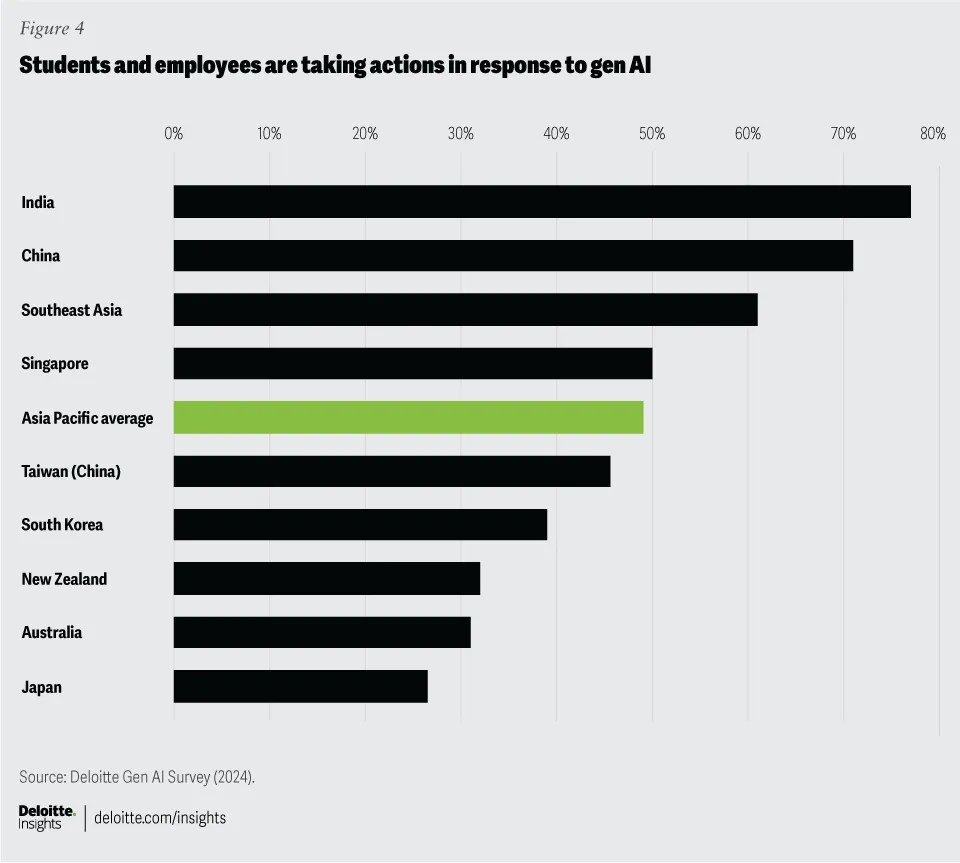
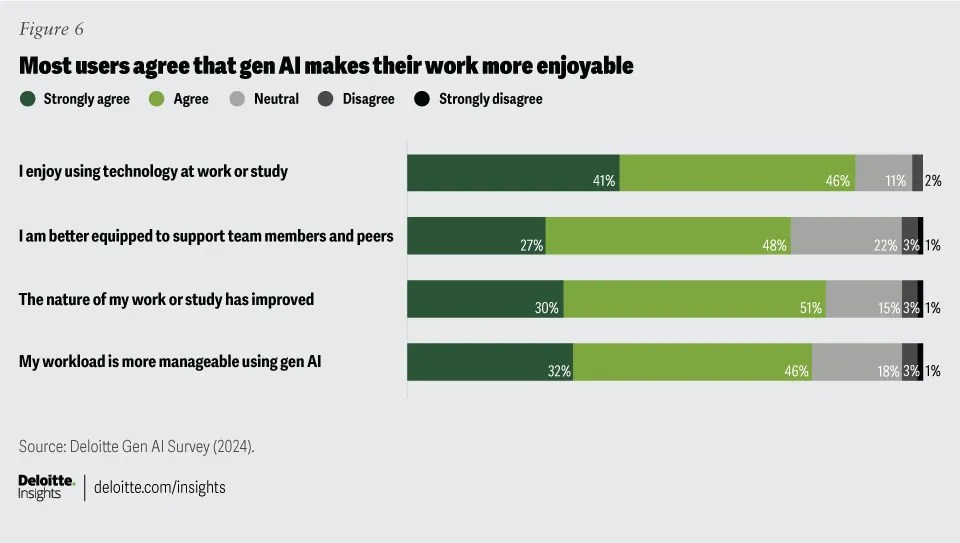
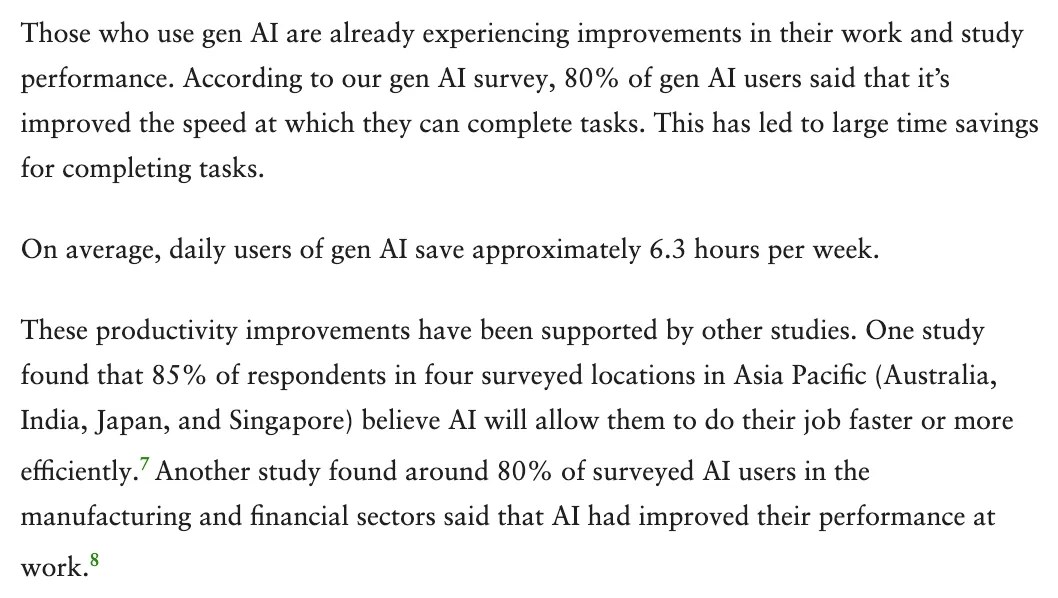
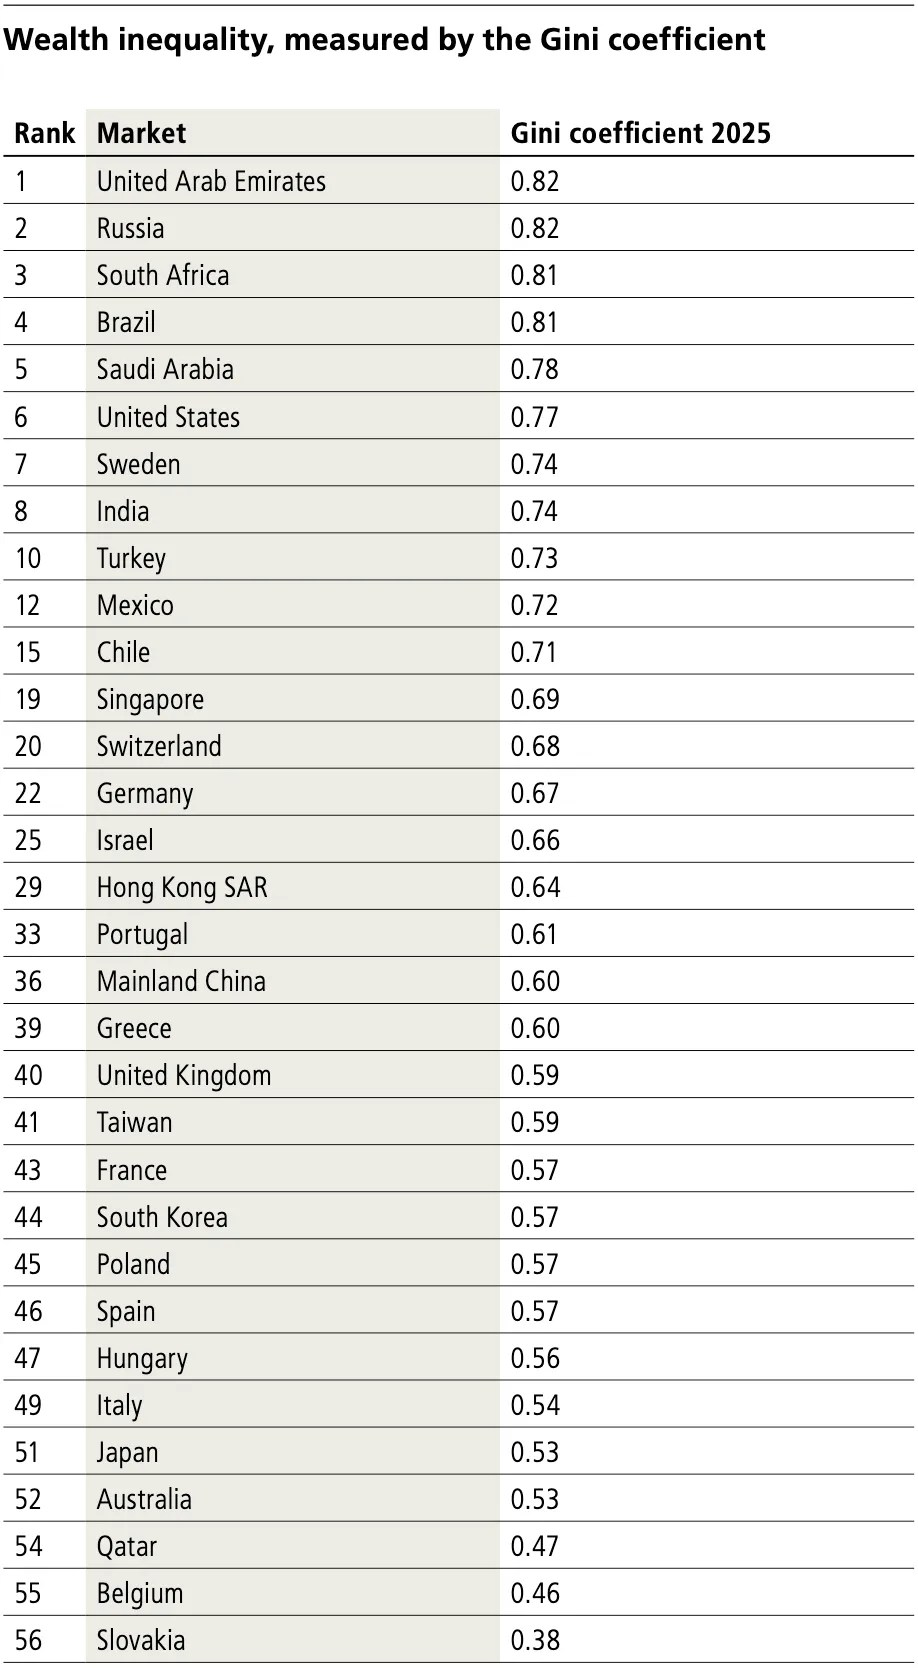
GVG and Jon Cartwright asked an important question in the video above: Will the new EU packaging regulation (PPWR) force the Game Card packaging to change by 2030? I’ll sidestep few imprecise points conveyed in the video, and attempt to answer the question below.
First of all, the limitation of 50% “empty space” (img below) applies only to shipping boxes and grouped packaging, not “sales packaging” such as Game Card cases.
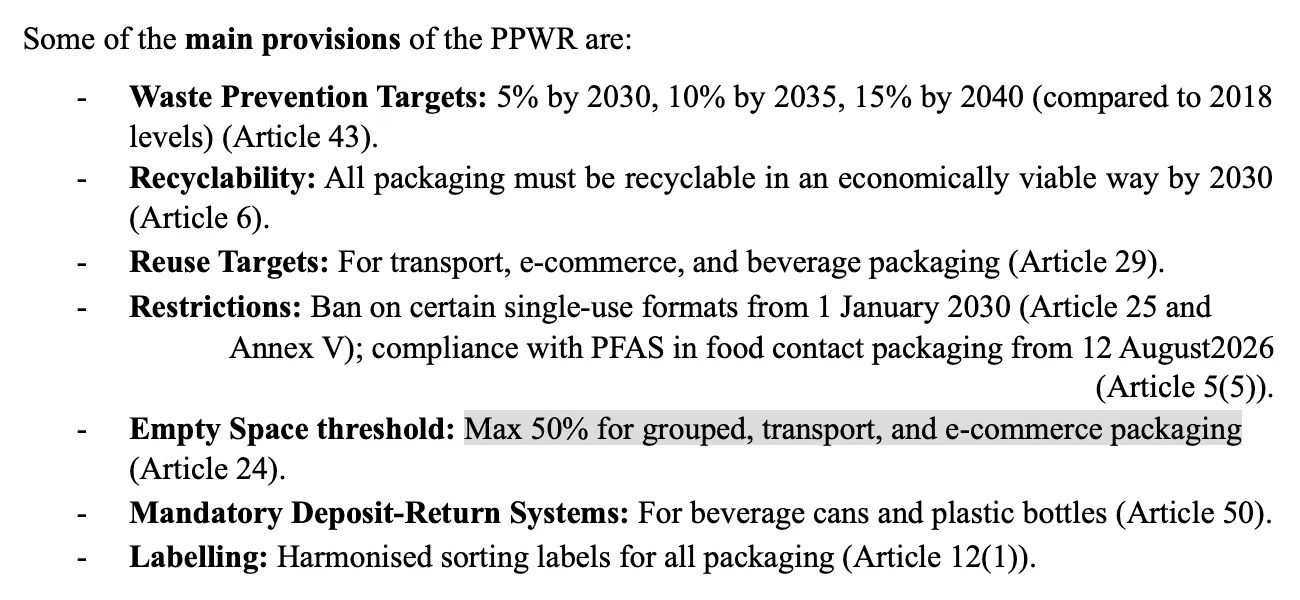
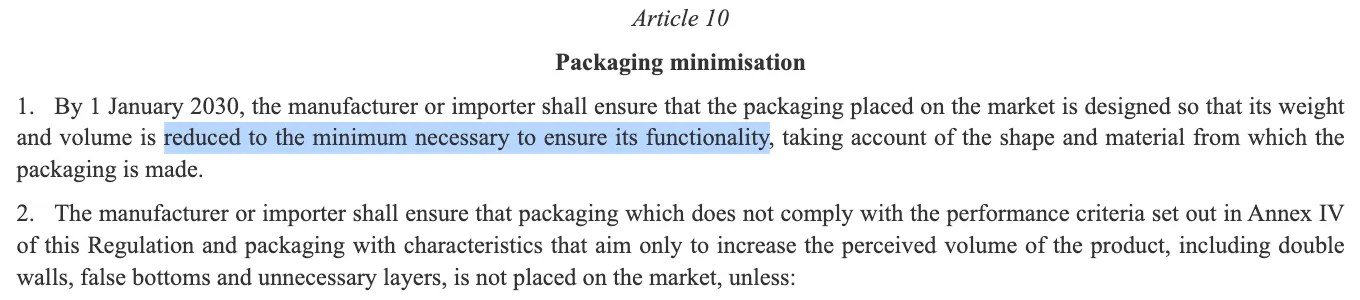
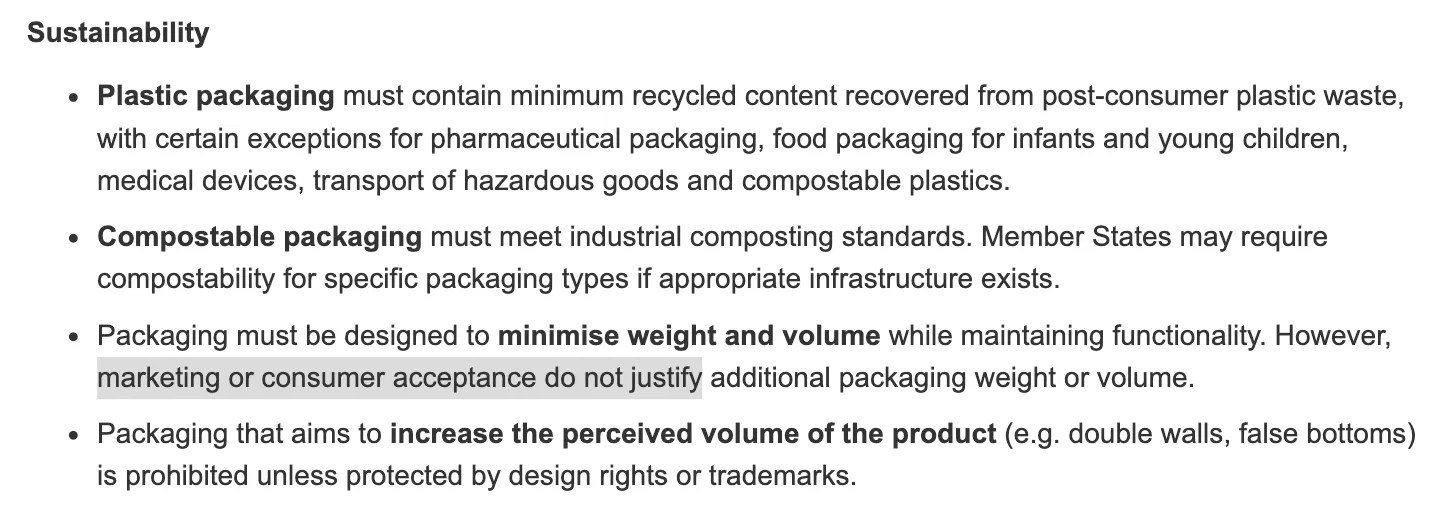
However, the sales packaging is still required to be “reduced to the minimum” (img 1 below), regardless of “marketing or consumer acceptance” (img 2). In other words, Nintendo cannot refuse to minimize the Game Card case just by saying “our customers like it”. They may, however, argue that the current packaging is “necessary to ensure its functionality”—e.g., to protect the Game Card and manual—and keep it unchanged.
There’s also an exemption that Nintendo might claim: packaging designs registered before 2025-02-11. This is another instance where Nintendo’s meticulous IP protection helps them, because (you guessed it) they did register the design of Game Card case on 2017-10-07 (imgs 1-2 below). It isn’t a get-out-of-jail-free card though. To claim the exemption, Nintendo needs to prove that minimization will alter the design’s novelty or character (img 3), not exactly a straightforward task.

![Cropped screenshot of EU design registration 004408284-0001 - Cases https://designdb.wipo.int/designdb/en/showData.jsp?ID=EMID.004408284-0001 (30) Data relating to priority claim under the Paris Convention 2017-06-07 - 2017-012247 - JP - [four views of the design from different angles]](https://ninpatentswatch.com/wp-content/uploads/2026/08/bsky-3msyuum6xxk2h-p4-m2.webp)
![Excerpt from REGULATION (EU) 2025/40 OF THE EUROPEAN PARLIAMENT AND OF THE COUNCIL of 19 December 2024 on packaging and packaging waste, amending Regulation (EU) 2019/1020 and Directive (EU) 2019/904, and repealing Directive 94/62/EC https://eur-lex.europa.eu/legal-content/EN/TXT/?uri=OJ:L_202500040 Article 10 Packaging minimisation […] the packaging design is protected by a Community design pursuant to Council Regulation (EC) No 6/2002 (64) or by design rights falling within the scope of Directive 98/71/EC of the European Parliament and of the Council (65), including international agreements having effect in one of the Member States, or its shape is a trademark falling within the scope of Regulation (EU) 2017/1001 of the European Parliament and of the Council (66) or Directive (EU) 2015/2436 of the European Parliament and of the Council (67), including trademarks registered under international agreements having effect in one of the Member States, the design rights and trademarks are protected before 11 February 2025, and the application of the requirements under this Article would affect the packaging design in a way that it would alter its novelty or its individual character, or would affect the trademark in a way that the trademark is no longer capable of distinguishing the marked product from those of other undertakings […]](https://ninpatentswatch.com/wp-content/uploads/2026/08/bsky-3msyuum6xxk2h-p5-m1.webp)
Lastly, collectors of special editions might be glad to hear that there’s a carve-out for packaging intended for “gift purposes”, “seasonal events”, and other particularities (img below). It seems that you may still be able to purchase luxurious collectible boxes post 2030.
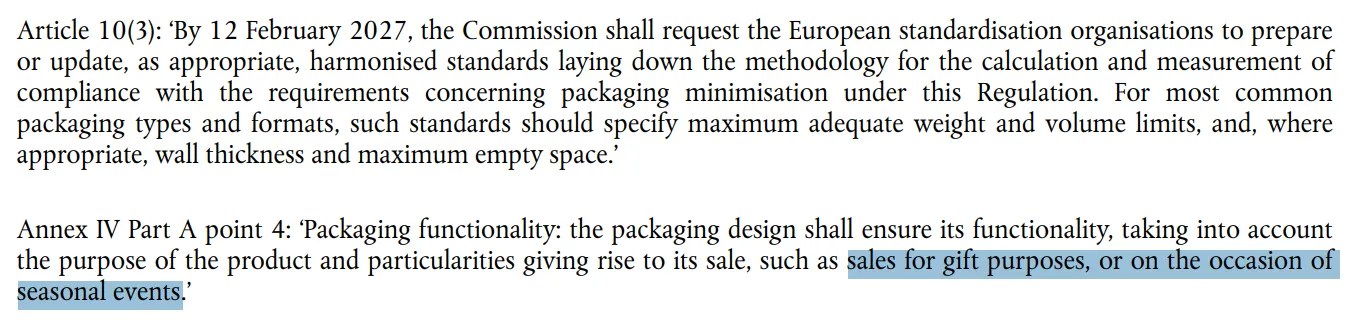
(sources in alt text)
[Originally posted on 2026-08-13 Pacific Time]




![[Chart] MegaChips net sales https://www.megachips.co.jp/english/irinfo/finance/sales/ 2022/3: 75,256 million JPY2023/3: 70,722 million JPY2024/3: 57,942 million JPY2025/3: 42,326 million JPY2026/3: 36,169 million JPY](https://ninpatentswatch.com/wp-content/uploads/2026/08/bsky-3msone64bhk2p-p1-m1.webp)
![[Slide] MegaChips FY2026 1Q(ending March 2027) Result https://pdf.irpocket.com/C6875/xoA3/ieAo/huql/Fbiv.pdf Consolidated results (P/L) Breakdown Sales +3,660M JPY 【Reasons for YoY Changes】 • Amusement business: Product sales increased yearon-year.](https://ninpatentswatch.com/wp-content/uploads/2026/08/bsky-3msone64bhk2p-p1-m2.webp)
![[Slide] Macronix International Co., Ltd. Second Quarter 2026 Results https://www.mxic.com.tw/Lists/QuarterlyResults/Attachments/656/2026q2webcast_ppt_en.pdf Quarterly Sales Breakdown by Products ROM QoQ Change +40% YoY Change +37%](https://ninpatentswatch.com/wp-content/uploads/2026/08/bsky-3msone64bhk2p-p2-m1.webp)
![[Slide] ROHM Co., Ltd. Financial Results for Q1 FY2026 https://fscdn.rohm.com/en/financial/account/2606_supplementary_en.pdf [Q1 FY2026] Sales by Market Segment (YoY) Consumer » Others +0.0 billion JPY](https://ninpatentswatch.com/wp-content/uploads/2026/08/bsky-3msone64bhk2p-p3-m1.webp)
![Rohm Financial Results for FY2025 (presentation slide): [FY2026 Plan] Sales by Market Segment (YoY) Consumer 1.5% Others +0.8 (Billion ¥)](https://ninpatentswatch.com/wp-content/uploads/2026/06/bsky-3mmsipbzqnk2f-p1-m2.webp)
![[Chart] Foxconn Technology Co. Revenue (unit: million NTD) 2024-01 3,448 2024-02 2,228 2024-03 3,165 2024-04 3,303 2024-05 4,220 2024-06 5,979 2024-07 7,826 2024-08 6,784 2024-09 5,606 2024-10 6,571 2024-11 11,452 2024-12 15,147 2025-01 8,503 2025-02 9,419 2025-03 12,051 2025-04 12,889 2025-05 14,754 2025-06 13,605 2025-07 15,585 2025-08 13,804 2025-09 12,963 2025-10 14,918 2025-11 13,830 2025-12 13,851 2026-01 13,391 2026-02 7,202 2026-03 4,689 2026-04 6,527 2026-05 8,758 2026-06 15,055 2026-07 21,422](https://ninpatentswatch.com/wp-content/uploads/2026/08/bsky-3mshlp3vyvk2w-p1-m1.webp)
![[Chart] Foxconn Technology Co. Revenue (unit: 100 million NTD) 2026-07 214.22 2026-06 150.55 2026-05 87.58 2026-04 65.27 2026-03 46.89 2026-02 72.02 2026-01 133.9 2025-12 138.5 2025-11 138.3 2025-10 149.2 2025-09 129.6 2025-08 138 2025-07 155.8 2025-06 136 2025-05 147.5 2025-04 128.9 2025-03 120.5 2025-02 94.19 2025-01 85.03 2024-12 151.5 2024-11 114.5 2024-10 65.71 2024-09 56.06 2024-08 67.84 2024-07 78.26 2024-06 59.79 2024-05 42.2 2024-04 33.03 2024-03 31.65 2024-02 22.28 2024-01 34.48 2023-12 31.43 2023-11 35.44 2023-10 53.97 2023-09 68.8 2023-08 78.93 2023-07 75.6 2023-06 60.63 2023-05 52.4 2023-04 50.2 2023-03 81.73 2023-02 63.55 2023-01 92.2 2022-12 112 2022-11 103 2022-10 86.69 2022-09 67.6 2022-08 55.54 2022-07 54.48 2022-06 56.35 2022-05 73.5 2022-04 60.57 2022-03 87.72 2022-02 57.1 2022-01 90.65 2021-12 80.15 2021-11 82.48 2021-10 116.5 2021-09 125 2021-08 113.4 2021-07 94.83 2021-06 74.04 2021-05 82.65 2021-04 68.34 2021-03 61.44 2021-02 46.09 2021-01 93.71 2020-12 102.1 2020-11 121.7 2020-10 119.7 2020-09 135.9 2020-08 111.2 2020-07 113.3 2020-06 93.01 2020-05 64.26 2020-04 72.25 2020-03 50.13 2020-02 13.32 2020-01 48.49 2019-12 67.64 2019-11 87.59 2019-10 110.5 2019-09 120.8 2019-08 135.4 2019-07 123.4 2019-06 85.4 2019-05 81.22 2019-04 59.77 2019-03 58.18 2019-02 25.64 2019-01 45.06 2018-12 75.27 2018-11 116.5 2018-10 124 2018-09 176.1 2018-08 147.4 2018-07 114.8 2018-06 119.7 2018-05 104.9 2018-04 104.6 2018-03 104.8 2018-02 87.3 2018-01 151.3 2017-12 189 2017-11 201.8 2017-10 212.5 2017-09 207.7 2017-08 149.1 2017-07 114.1 2017-06 101.4 2017-05 64 2017-04 55.63 2017-03 63.05 2017-02 43.66 2017-01 81.81](https://ninpatentswatch.com/wp-content/uploads/2026/08/bsky-3mshlp3vyvk2w-p2-m1.webp)
![[Slide] Nintendo Financial Results Explanatory Material, 1st Quarter of Fiscal Year Ending March 2024: Nintendo Switch: Hardware Sell-through and Annual Playing Users Hardware sell-through exceeded the level of the same quarter last FY (April-June Totals) The graph on the left shows global hardware sell-through from April through June. Global hardware sell-through in the first quarter increased compared to the same quarter last fiscal year, helped by sales of Nintendo Switch ‒ OLED Model, including Nintendo Switch ‒ OLED Model - The Legend of Zelda: Tears of the Kingdom Edition, which was launched at the end of April.](https://ninpatentswatch.com/wp-content/uploads/2026/08/bsky-3mshlp3vyvk2w-p4-m1.webp)

![[Chart] Nintendo Inventories (unit: million yen) 2011-03 92,713 2011-06 101,034 2011-09 108,642 2011-12 67,618 2012-03 78,446 2012-06 73,290 2012-09 117,176 2012-12 126,853 2013-03 178,722 2013-06 183,909 2013-09 217,778 2013-12 178,940 2014-03 160,801 2014-06 136,454 2014-09 126,834 2014-12 95,511 2015-03 76,897 2015-06 77,101 2015-09 102,945 2015-12 51,458 2016-03 40,433 2016-06 36,127 2016-09 49,056 2016-12 39,817 2017-03 39,129 2017-06 63,240 2017-09 135,581 2017-12 94,691 2018-03 141,795 2018-06 212,843 2018-09 326,066 2018-12 181,839 2019-03 135,470 2019-06 133,156 2019-09 217,103 2019-12 100,151 2020-03 88,994 2020-06 95,350 2020-09 140,691 2020-12 82,229 2021-03 86,817 2021-06 157,707 2021-09 270,131 2021-12 169,256 2022-03 204,183 2022-06 256,241 2022-09 295,347 2022-12 203,828 2023-03 258,628 2023-06 262,754 2023-09 317,285 2023-12 173,556 2024-03 155,987 2024-06 212,879 2024-09 264,155 2024-12 326,468 2025-03 486,428 2025-06 425,828 2025-09 492,696 2025-12 410,191 2026-03 539,804 2026-06 618,006](https://ninpatentswatch.com/wp-content/uploads/2026/08/bsky-3msfk5lbrkk2q-p1-m2.webp)