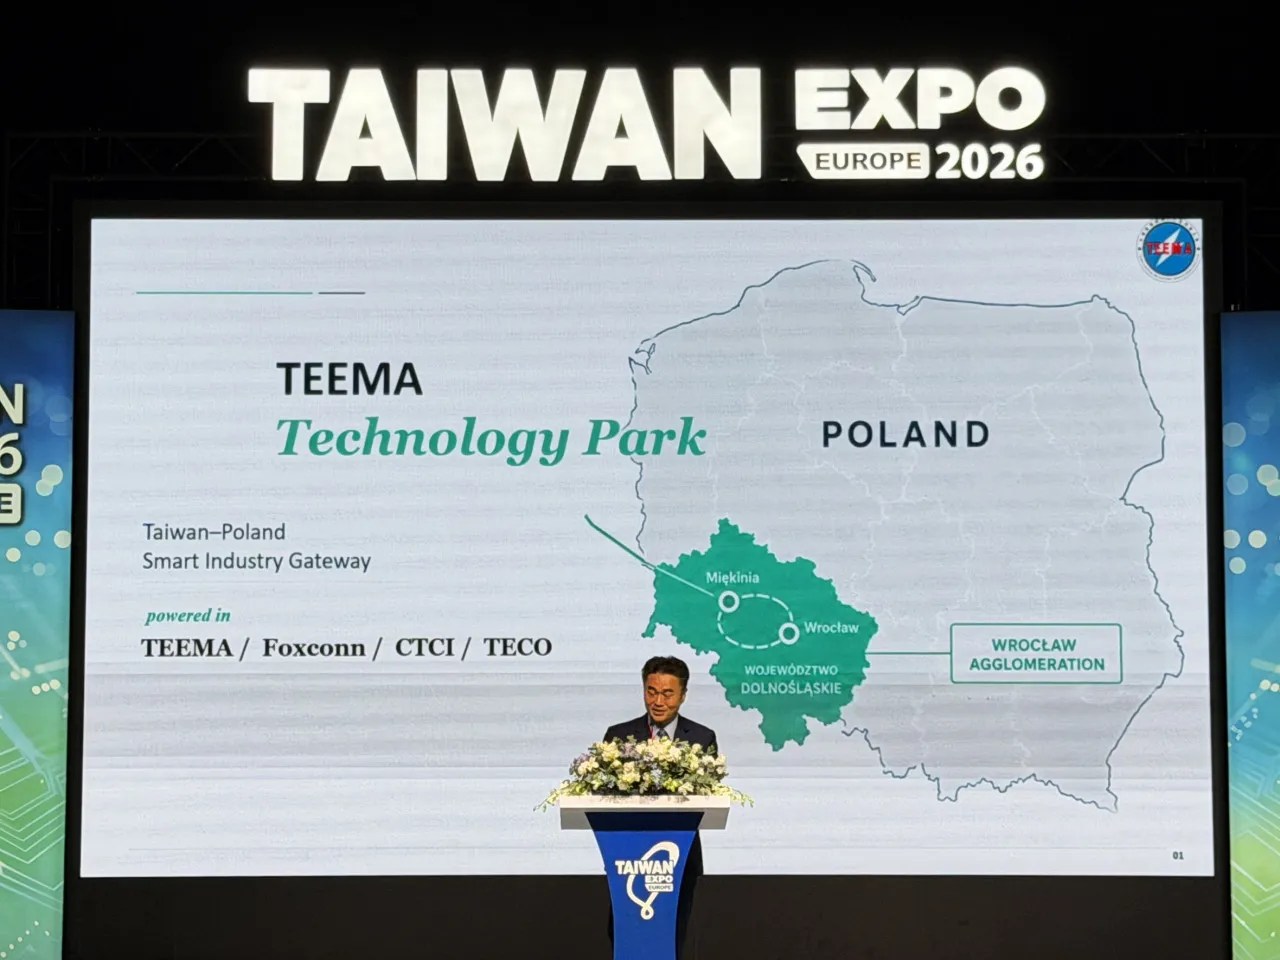
![[Photo] Tsai Sung-hui, Deputy Secretary-General of the Taiwan Electrical and Electronic Manufacturers' Association (TEEMA), announced that TEEMA Park would be located in Miękinia during the opening of the Taiwan Expo in Europe, held in Warsaw, Poland, on June 22.](https://ninpatentswatch.com/wp-content/uploads/2026/09/bsky-3mw7mmqhjak2j-p1-m1.webp)
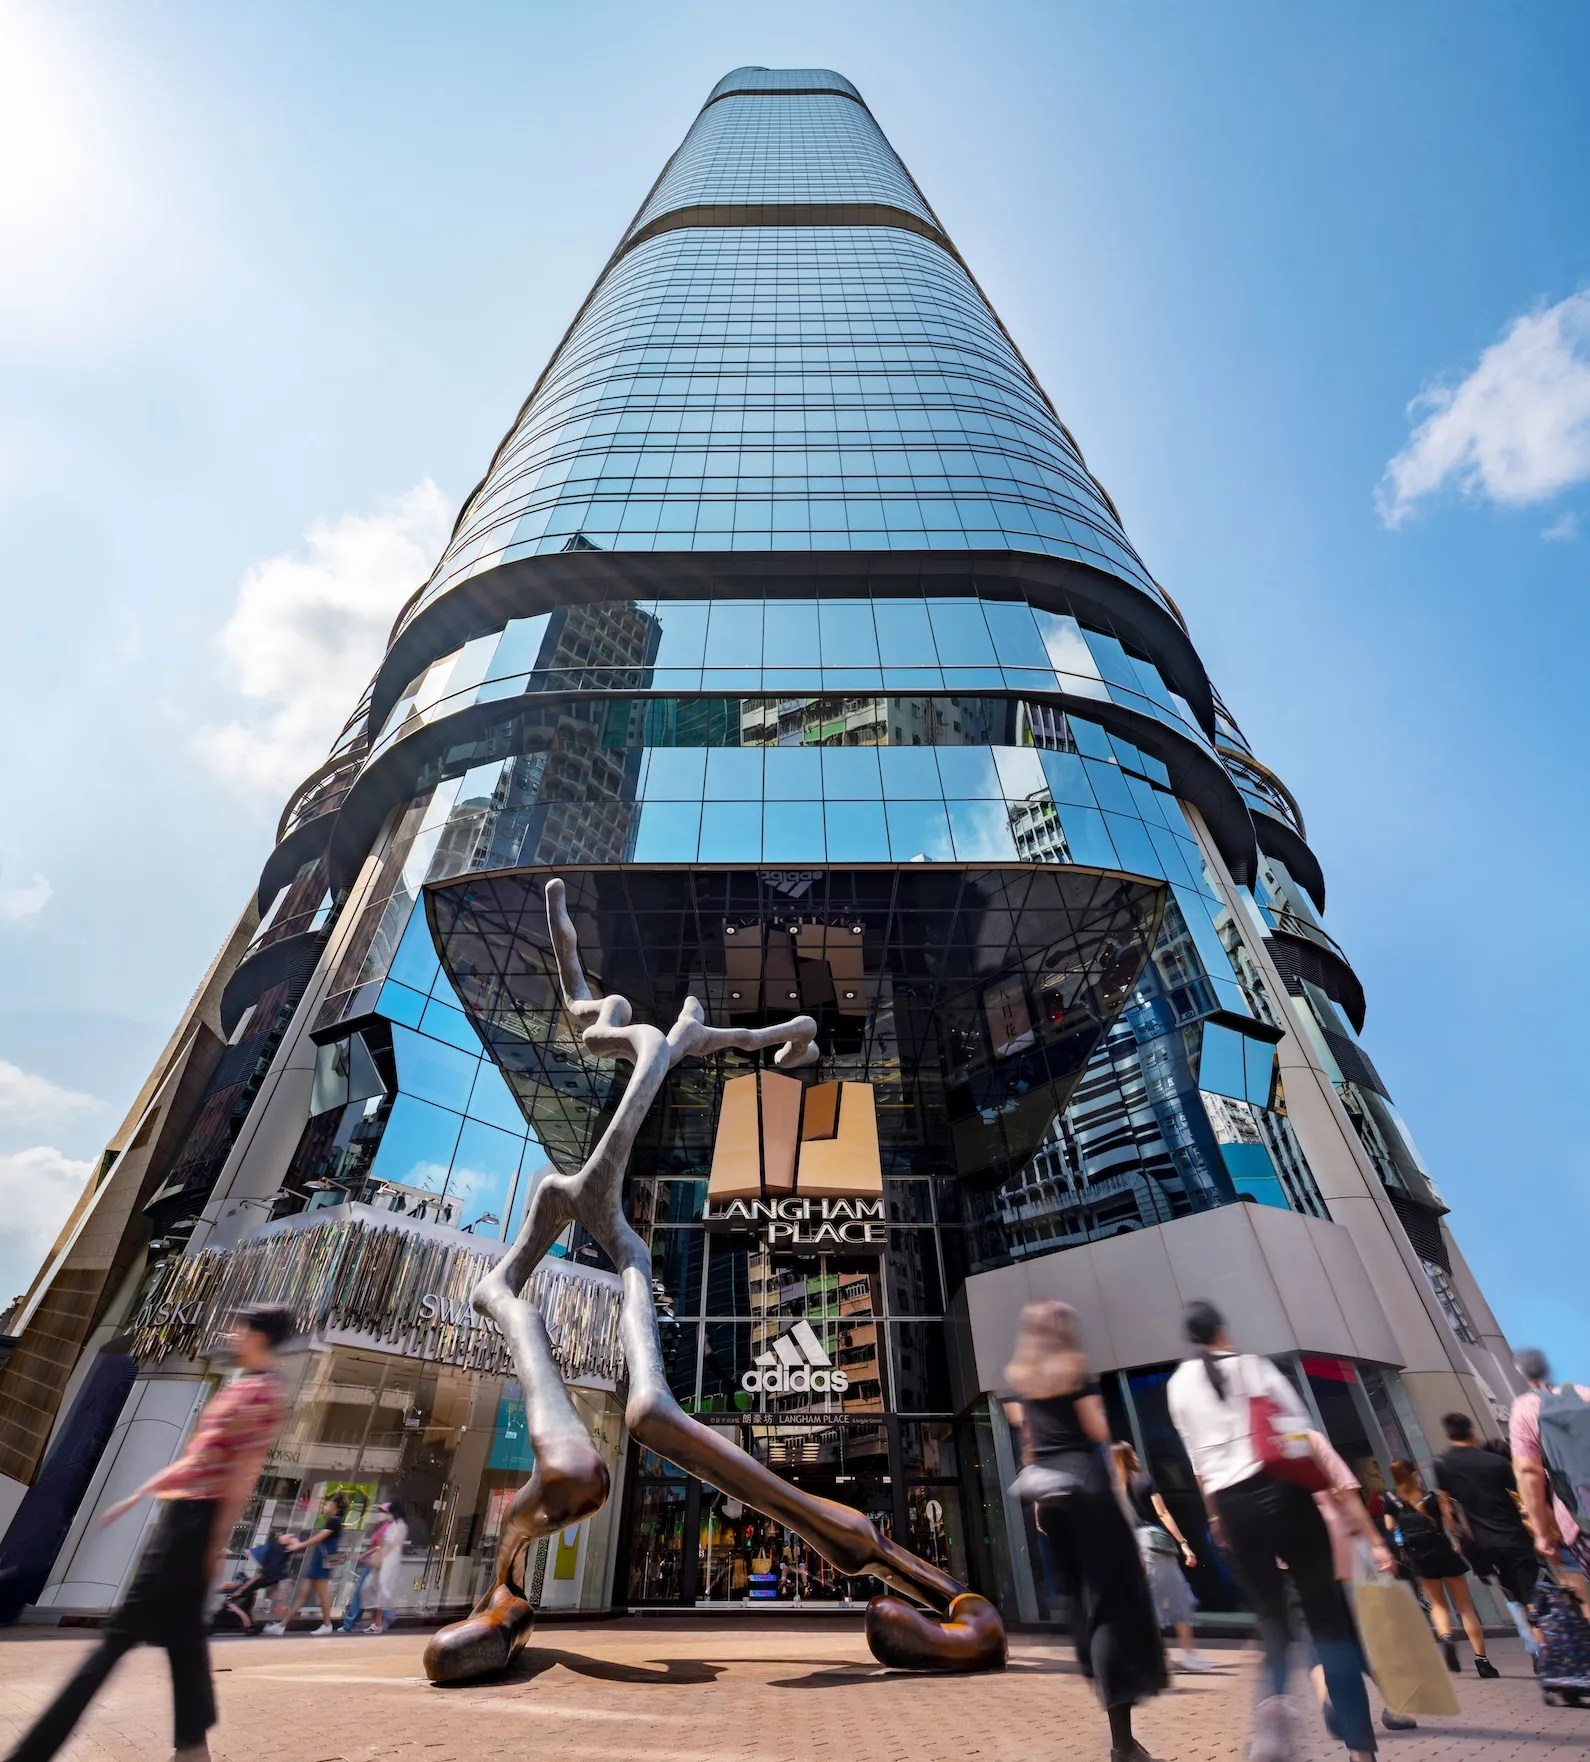
Led by Foxconn, the Taiwan Electrical and Electronic Manufacturers’ Association (TEEMA) will build a multibillion Technology Park in Poland, taking over the land originally reserved for Intel. Although the plan is to make AI servers and EV parts, once the manufacturing capacity is established, it’s possible to produce components and/or assemble products for gaming in Poland.
Currently Nintendo and other gaming hardware companies rely heavily on East Asian supply chains. A manufacturing hub in EU will be a welcome hedge against geopolitical risks.
Sources: Business Today (今周刊) and Nikkei Asia
[Originally posted on 2026-09-23 Pacific Time]
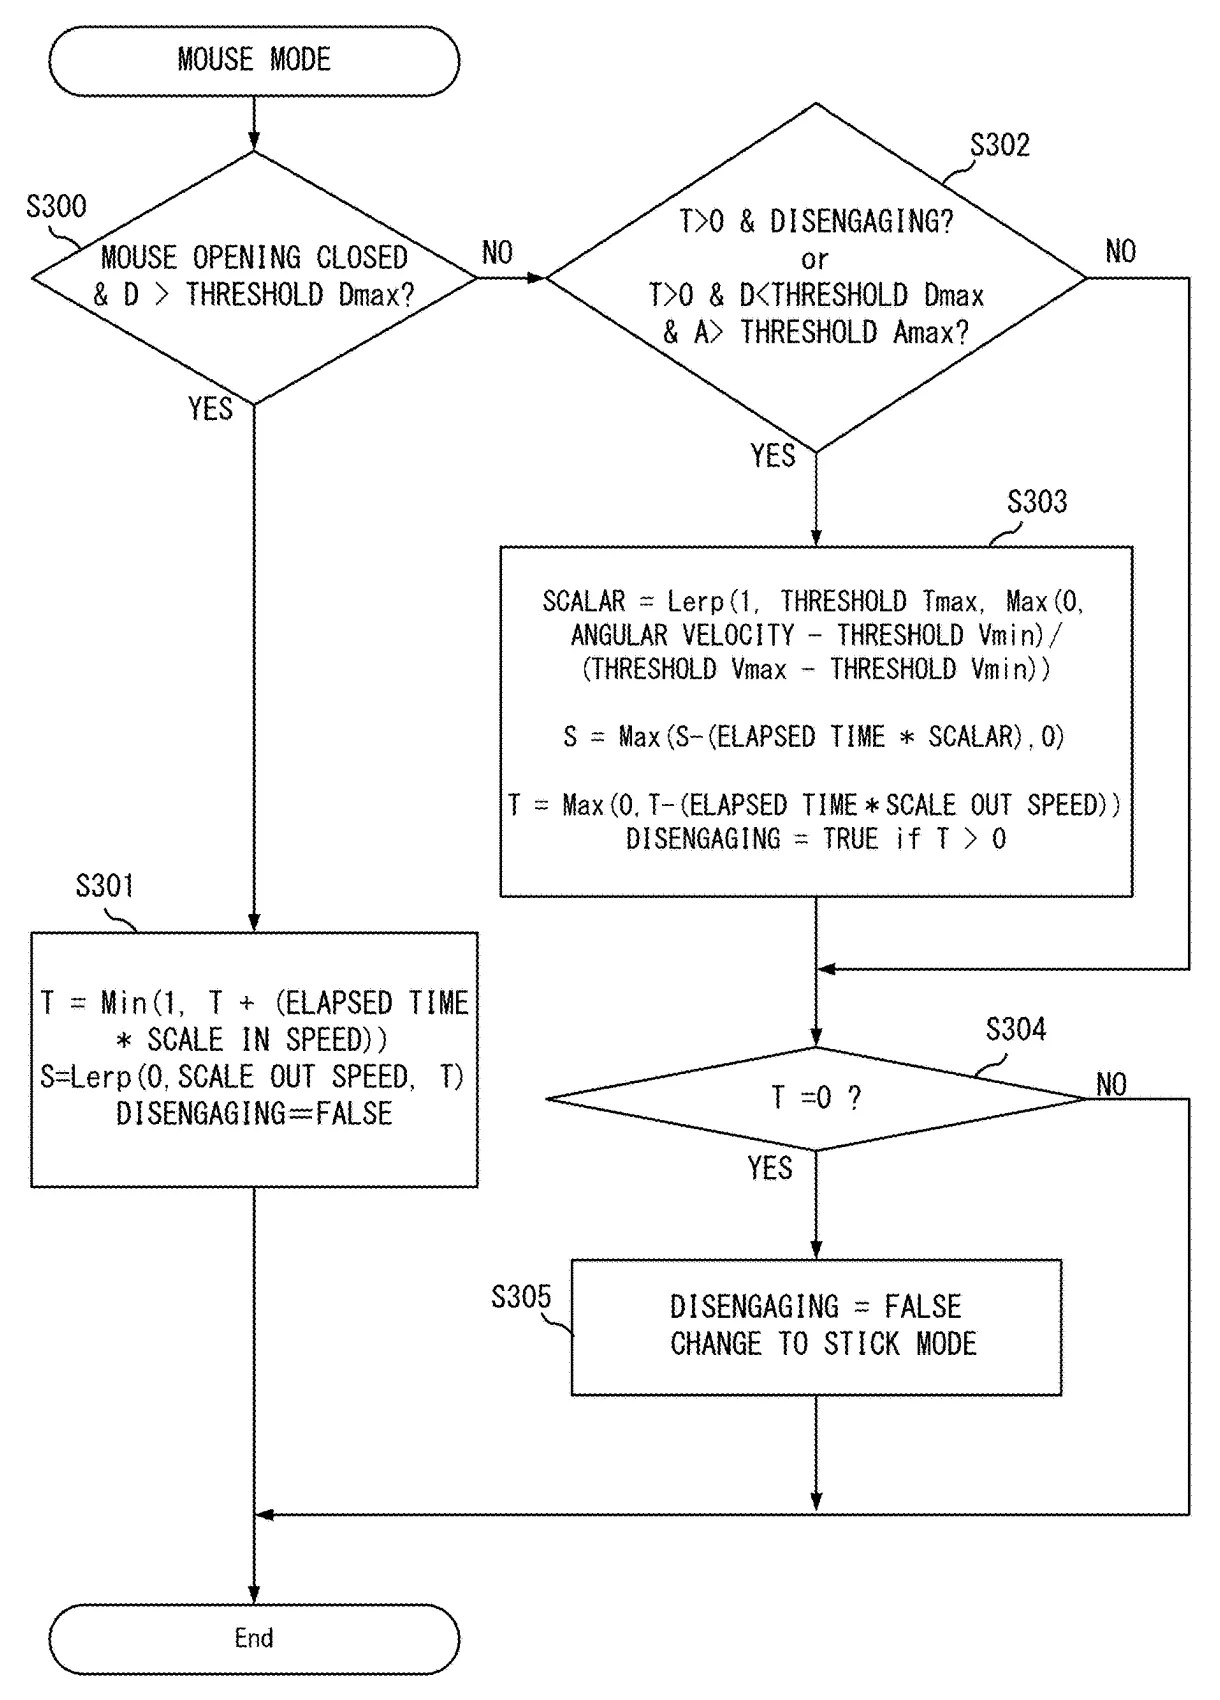
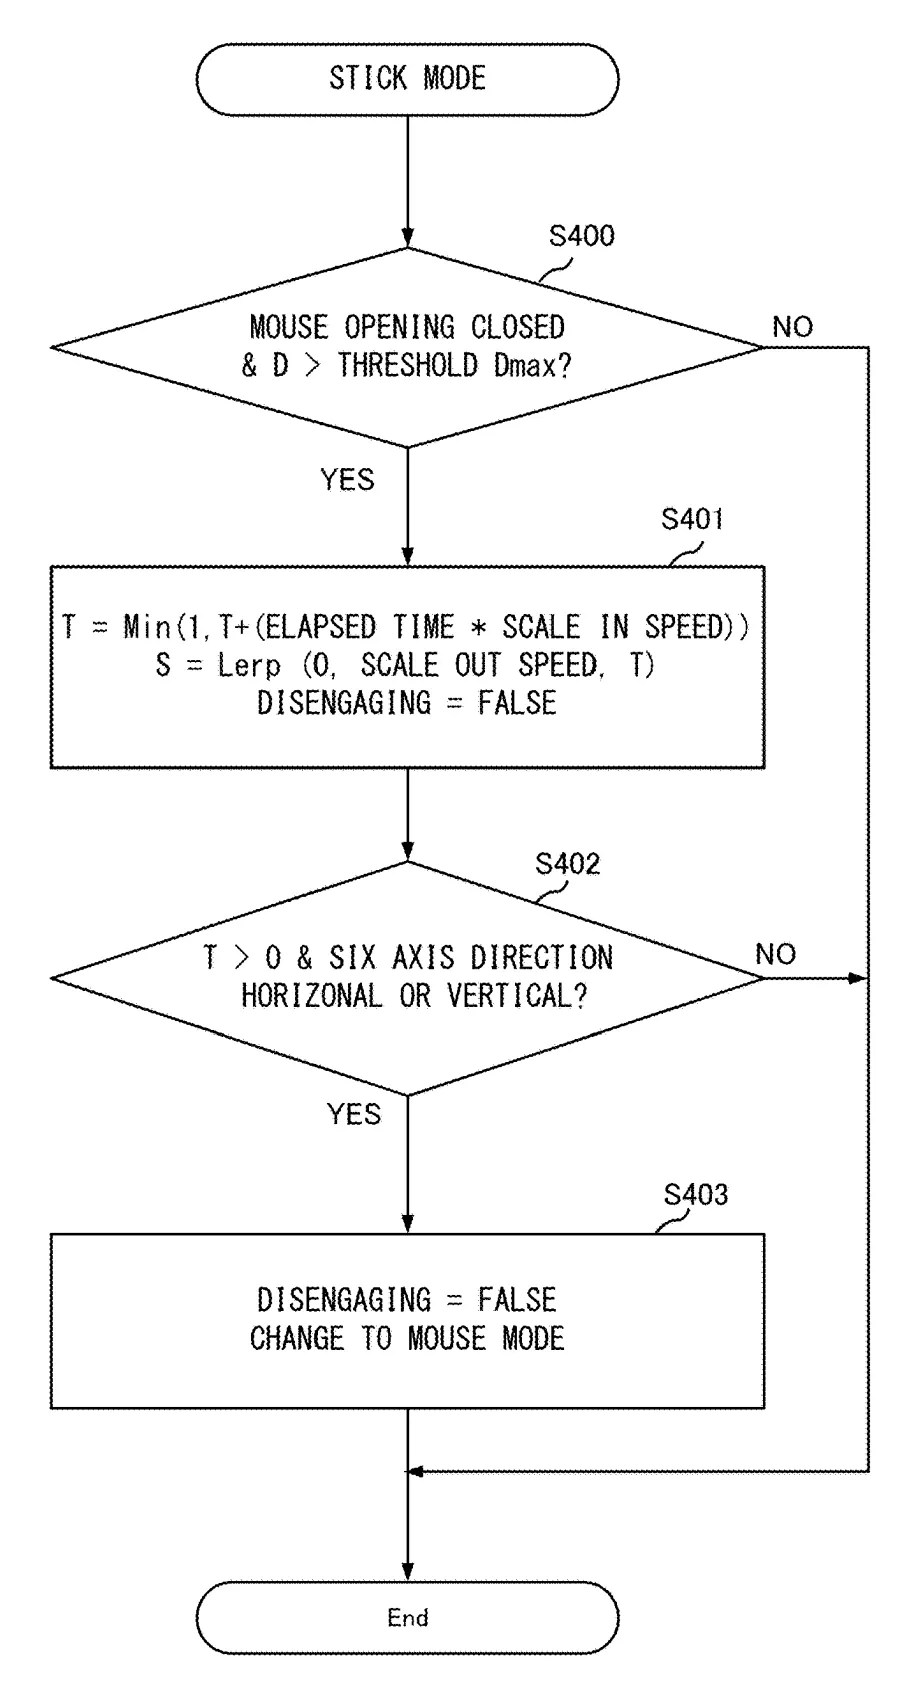
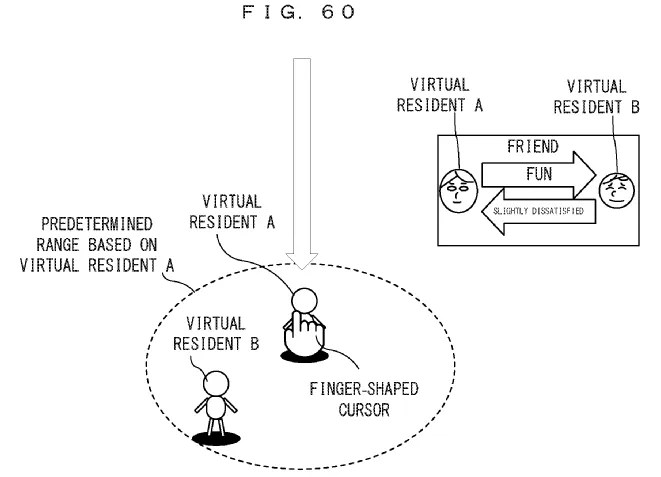
![Drawing from patent application WO 2025134263: [図6] 本ゲームの操作方法を説明するための図](https://ninpatentswatch.com/wp-content/uploads/2025/08/bafkreiexcokjns3ig5otfwchvz67dz67bzsi2c2plntxugd333d4neom3e.jpg)

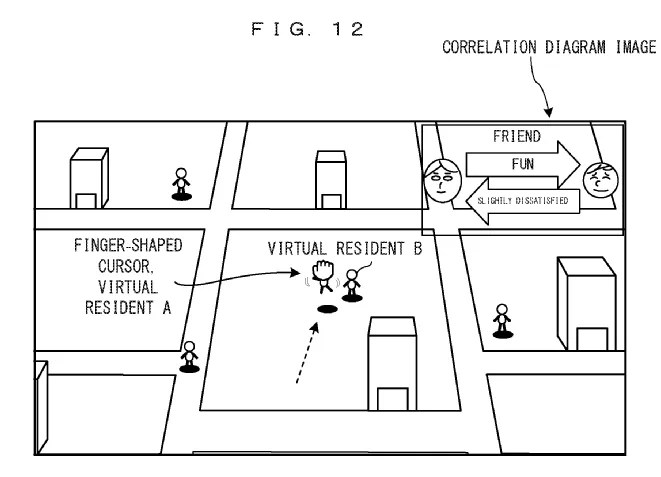
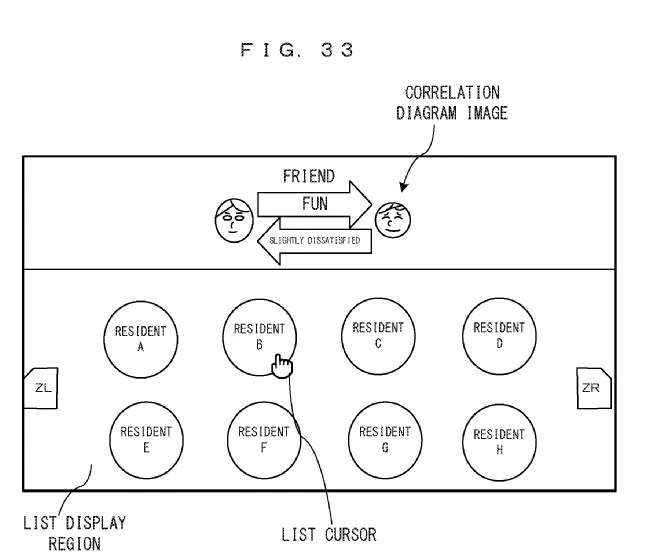
![Drawing from patent application WO 2025083780: [図13] 第2の実施形態におけるゲーム処理例において、入力装置9に対する方向指示操作に応じて表示されるゲーム画像の一例を示す図](https://ninpatentswatch.com/wp-content/uploads/2025/08/bafkreigbgybgdlo3lm33erh2ik4icnr5j4bujjf4yvjaprgfde2euqpi4u.jpg)


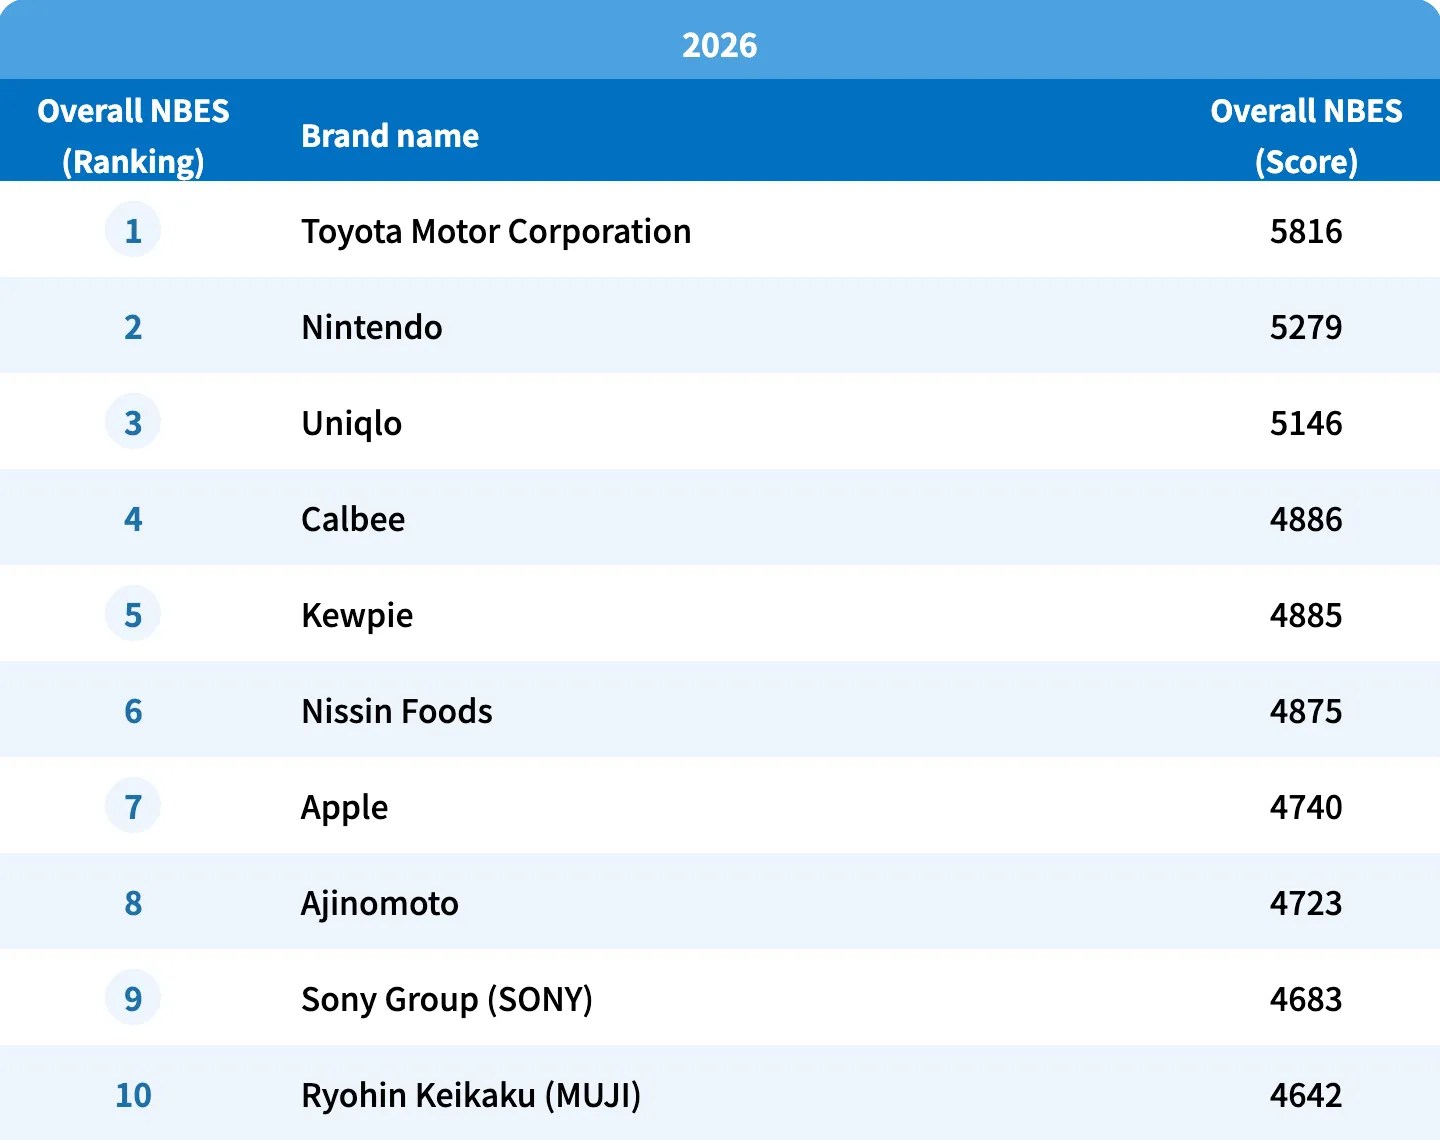
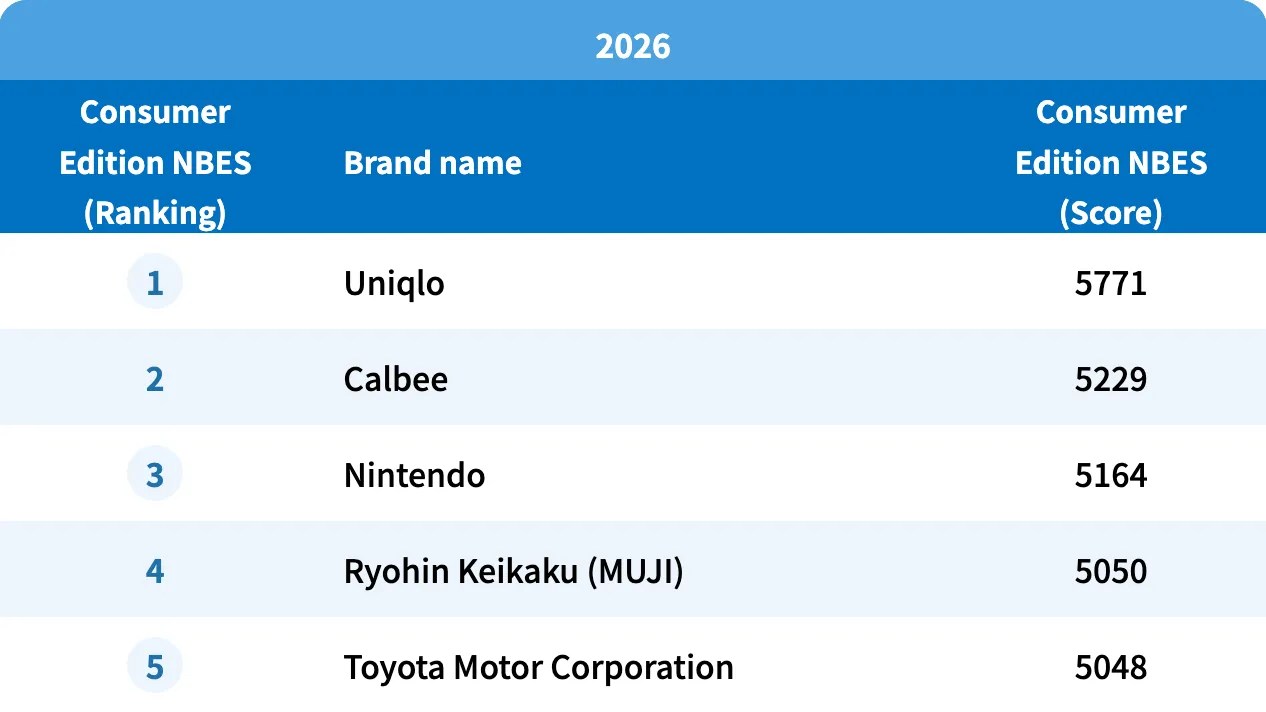
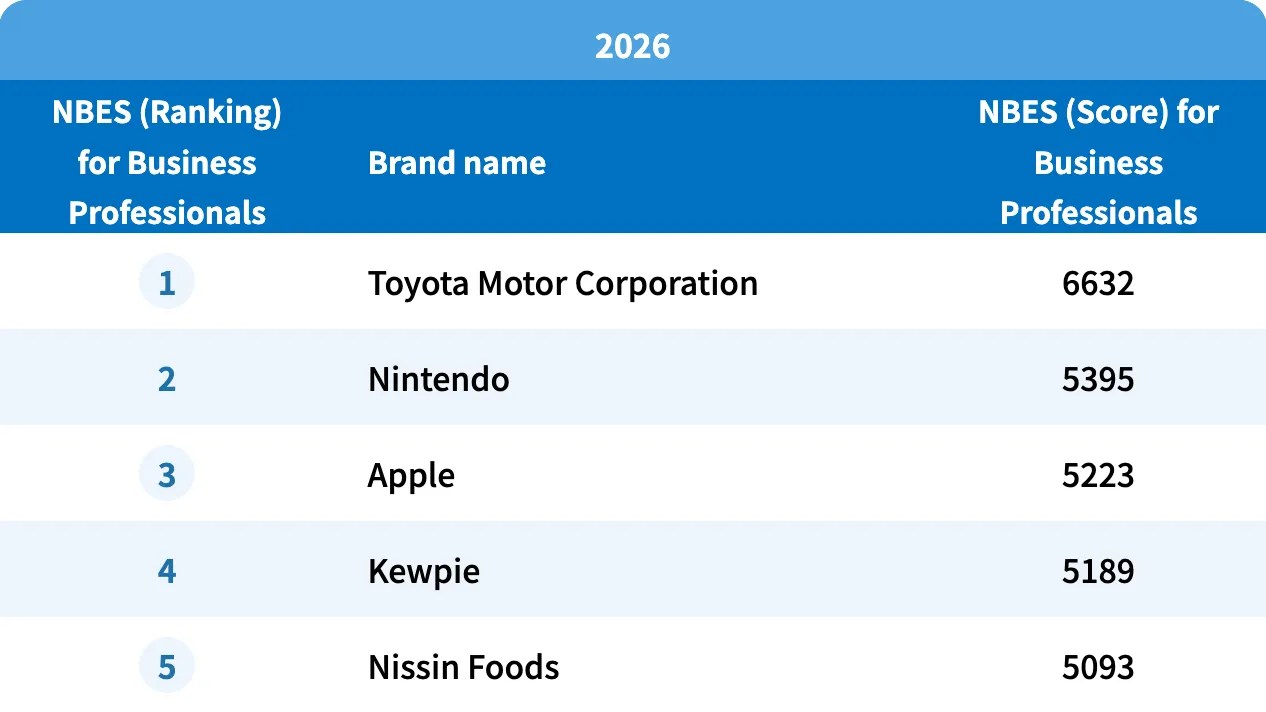
![Corporate Brand Power [Overall Ranking] TOP 20 Overall NBES (Ranking) Brand name Overall NBES (Score) 1 Toyota Motor Corporation 5816 2 nintendo 5279 3 Uniqlo 5146 4 Calbee 4886 5 Kewpie 4885 6 Nissin Foods 4875 7 Apple 4740 8 Ajinomoto 4723 9 Sony Group (SONY) 4683 10 Ryohin Keikaku (MUJI) 4642 11 Panasonic 4550 12 Kirin Beer 4379 13 TOTO 4337 14 Google 4303 15 Yakult Honsha 4276 16 Kao 4261 17 Kagome 4255 18 Nike 4221 19 Calpis 4199 20 Yamato Transport 4198](https://ninpatentswatch.com/wp-content/uploads/2026/09/bsky-3mvrs6h4fa22l-p1-m1.webp)


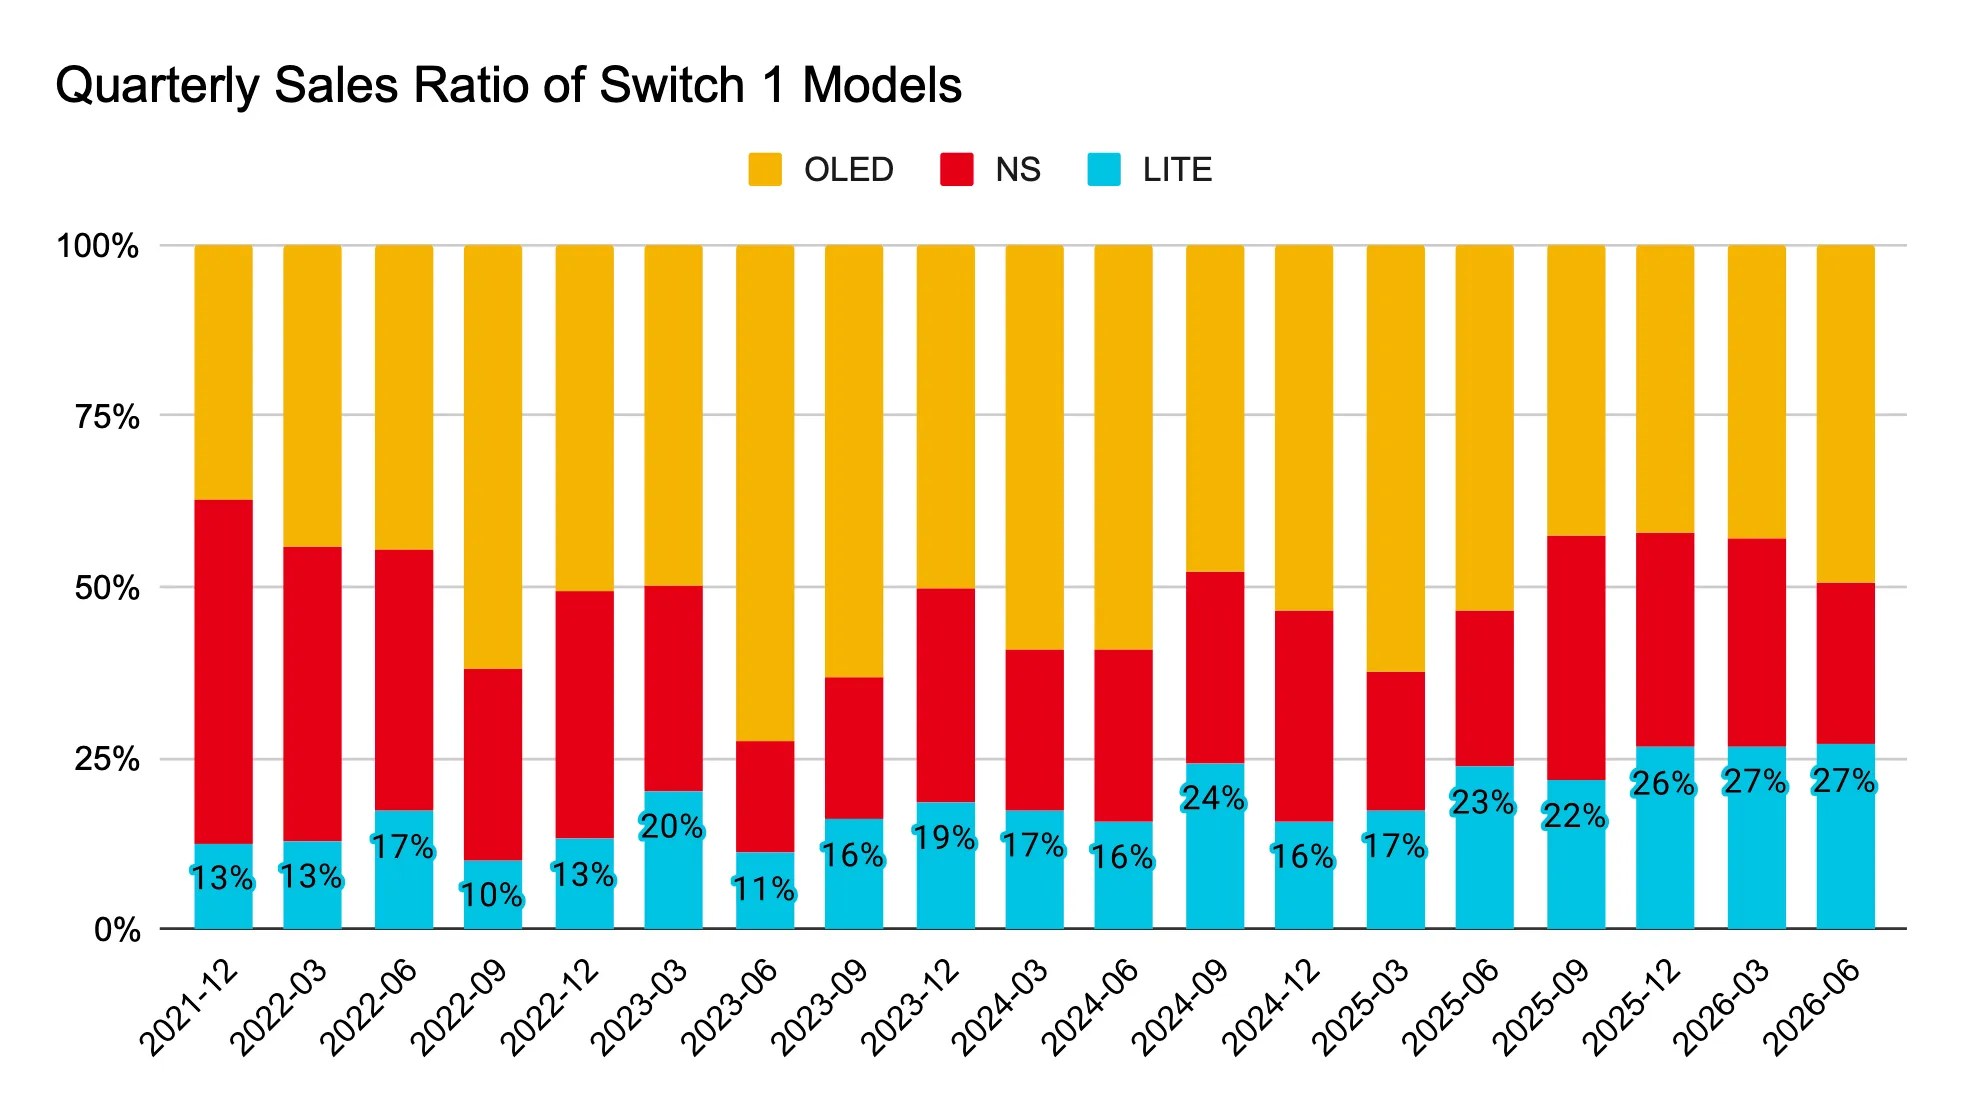
![[Chart] Quarterly sales ratio of Switch 1 models Total units OLED units OLED % Switch units Switch % Lite units Lite % 2021-12 1,067 399 37% 534 50% 135 13% 2022-03 411 181 44% 177 43% 53 13% 2022-06 343 152 44% 132 38% 59 17% 2022-09 325 201 62% 91 28% 33 10% 2022-12 823 416 51% 299 36% 108 13% 2023-03 306 153 50% 92 30% 62 20% 2023-06 391 283 72% 64 16% 43 11% 2023-09 293 186 63% 61 21% 47 16% 2023-12 690 348 50% 215 31% 128 19% 2024-03 196 115 59% 46 23% 34 17% 2024-06 210 124 59% 53 25% 33 16% 2024-09 262 126 48% 73 28% 64 24% 2024-12 482 257 53% 148 31% 76 16% 2025-03 126 79 63% 26 21% 22 17% 2025-06 98 52 53% 22 22% 23 23% 2025-09 91 39 43% 33 36% 20 22% 2025-12 136 57 42% 43 32% 36 26% 2026-03 55 24 44% 17 31% 15 27% 2026-06 66 33 50% 16 24% 18 27% (units in ten thousands)](https://ninpatentswatch.com/wp-content/uploads/2026/09/bsky-3mvo3xpqpbk2p-p2-m1.webp)
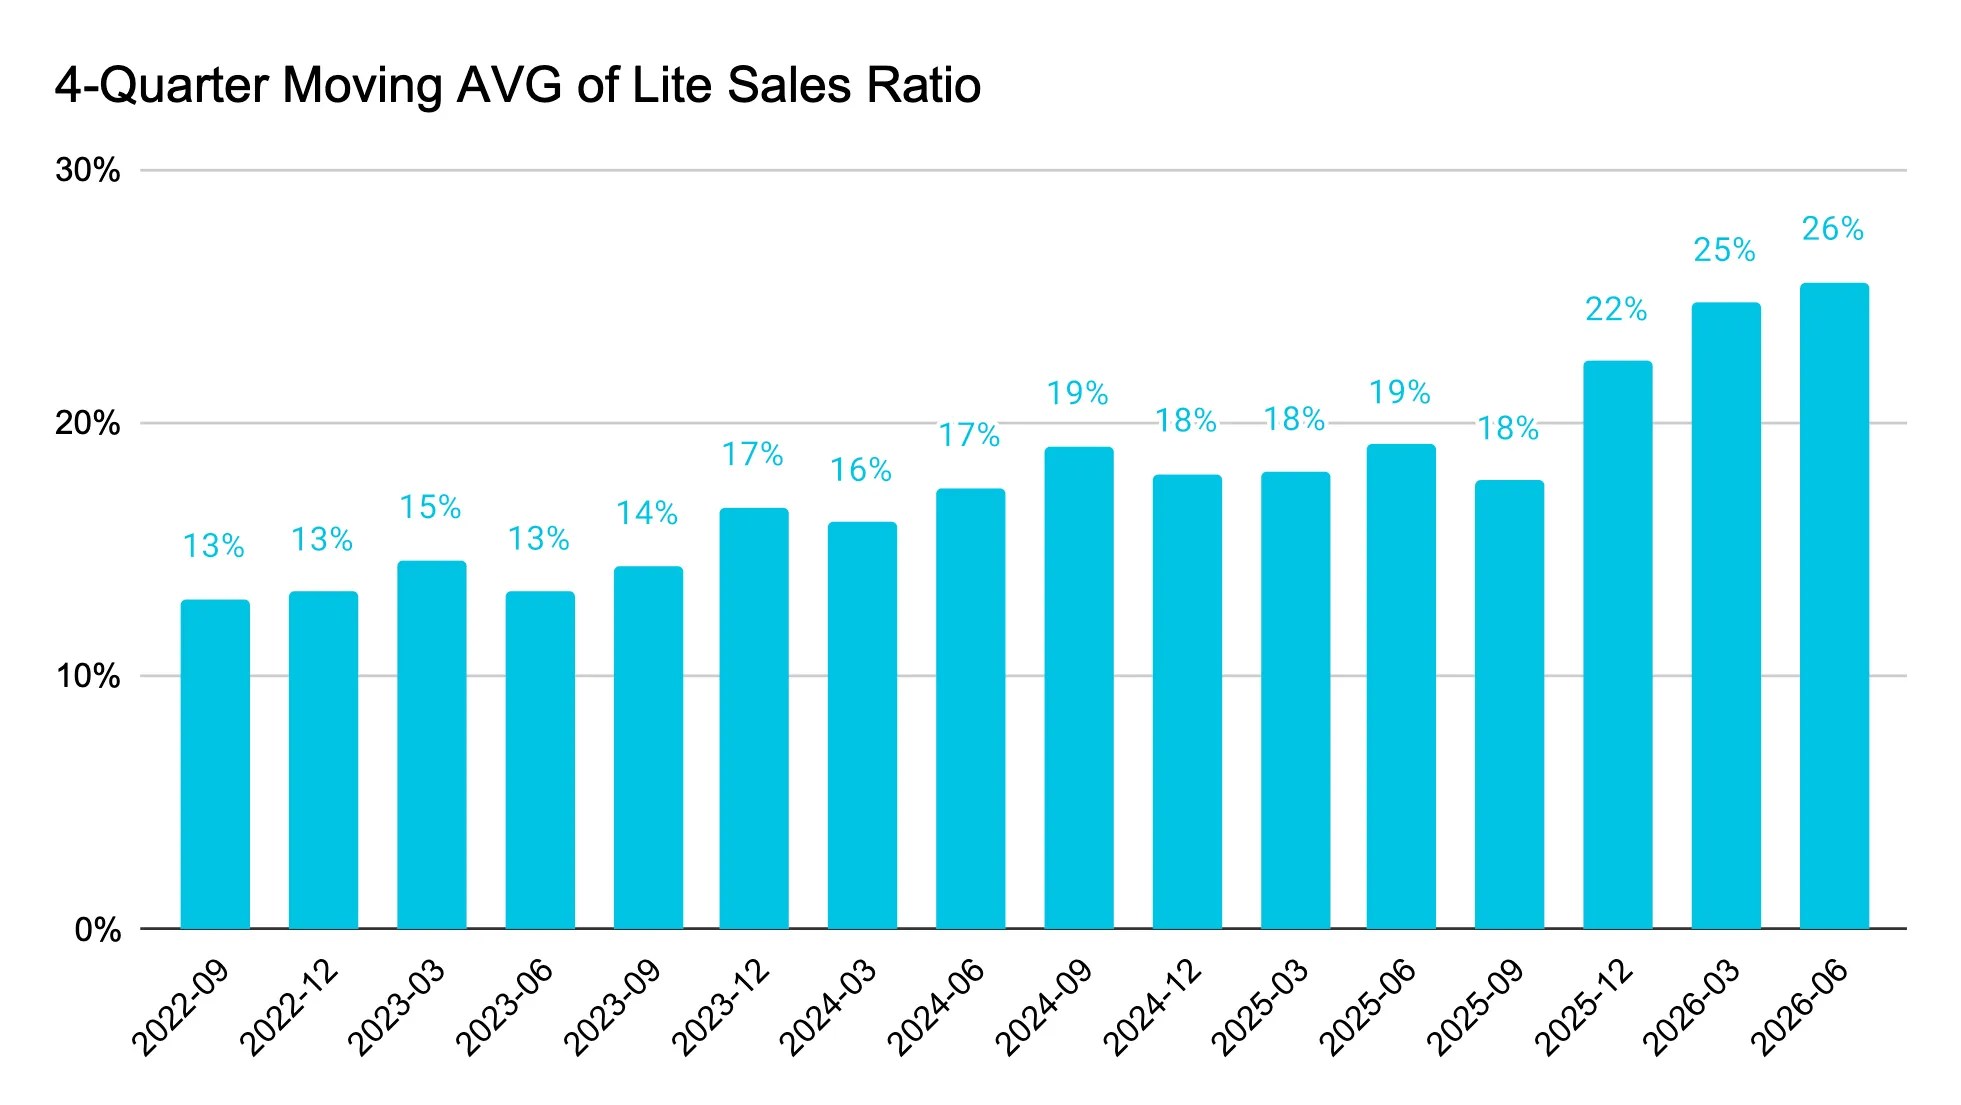
![[Chart] 4-quarter moving AVG of Lite sales ratio Lite Moving AVG 2021-12 2022-03 2022-06 2022-09 13% 2022-12 13% 2023-03 15% 2023-06 13% 2023-09 14% 2023-12 17% 2024-03 16% 2024-06 17% 2024-09 19% 2024-12 18% 2025-03 18% 2025-06 19% 2025-09 18% 2025-12 22% 2026-03 25% 2026-06 26%](https://ninpatentswatch.com/wp-content/uploads/2026/09/bsky-3mvo3xpqpbk2p-p2-m2.webp)